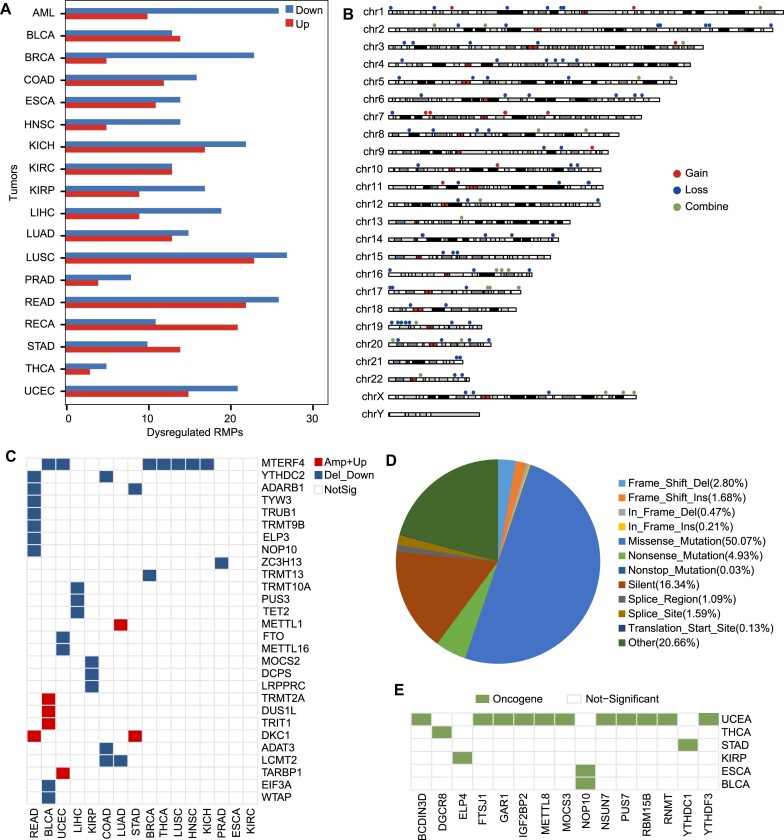
Figure 4.
Exploration of dysregulated expression profiles and mutation maps of RMPs in tumors. (A) Barplot shows the up-regulated (red) and down-regulated RMPs in 18 types of tumors. (B) Chromosome plot displays the distributions of RMPs with recurrent SCNA in the genome. Red indicates RMPs gain extra copy number(s). Blue indicates RMPs lose copy number(s). Green indicates RMPs displays copy number gains or losses in different tumor types. (C) Heatmap shows recurrent SCNA-driver RMPs in 16 types of tumors in RMBase v3.0. (D) Distribution of diverse somatic mutations occurred on RMPs. (E) Somatic mutation-driver RMPs on diverse tumors in RMBase v3.0.

