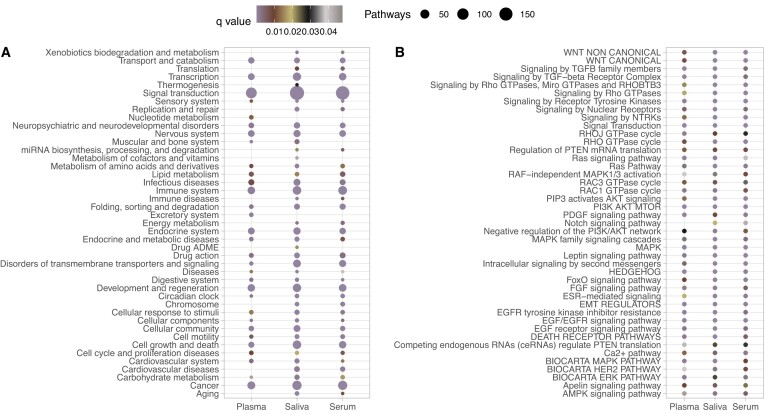
Figure 4.
Pathways enriched in gene targets of microRNAs linked to TBI. Results are shown per biofluid. Panel A shows the number of pathways in each category, together with the lowest q-value in that category, while panel B shows the q-value for each pathway annotated with Signal transduction category and present in all three biofluids.

