Fig. 1.
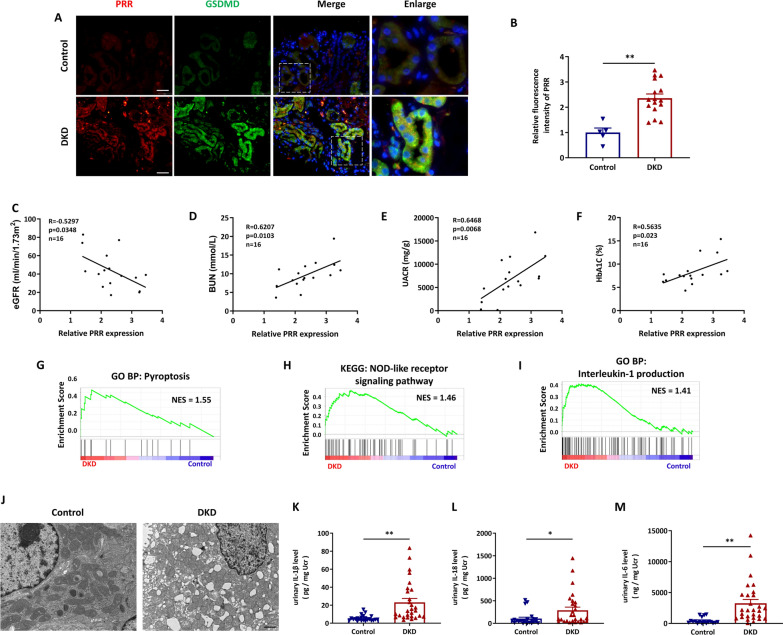
PRR expression and cell pyroptosis were increased in renal tubules of DKD patients. A and B Representative fluorescent images of coimmunostaining PRR (red) with GSDMD (green) in kidney biopsies from DKD patients (n = 16), and the control subjects were from paracancerous tissue (n = 5) (A), and quantitative data showed the upregulation of PRR in renal tubule. Bar = 20 μm. (B). C–F Analysis of the association between relative tubular PRR expression and eGFR(C), BUN (D), urinary albumin-to-creatinine ratio (UACR) (E) and Hemoglobin A1c (HbA1c) (F) of patients with DKD. (G–I) GSEA analysis of pyroptosis (G), NOD-like receptor signaling pathway (H) and Interleukin-1 production (I) in renal tubules of DKD patients (n = 10) and healthy controls (n = 12) by using public GSE dataset (GSE30529). J Representative microscopy images of tubular cell morphology in renal sections from DKD patients and health controls. Bar = 1 μm. (K and L) Elisa detection of urinary IL-1β (K) and IL-18 (L) from DKD patients (n = 28) and health controls (n = 23). M Elisa detection of urinary IL-6 from DKD patients (n = 28) and health controls (n = 18). Data are presented as mean ± SEM of biologically independent samples. ∗P < 0.05, ∗∗P < 0.01. P values were determined by Student’s t-test for comparison between two groups

