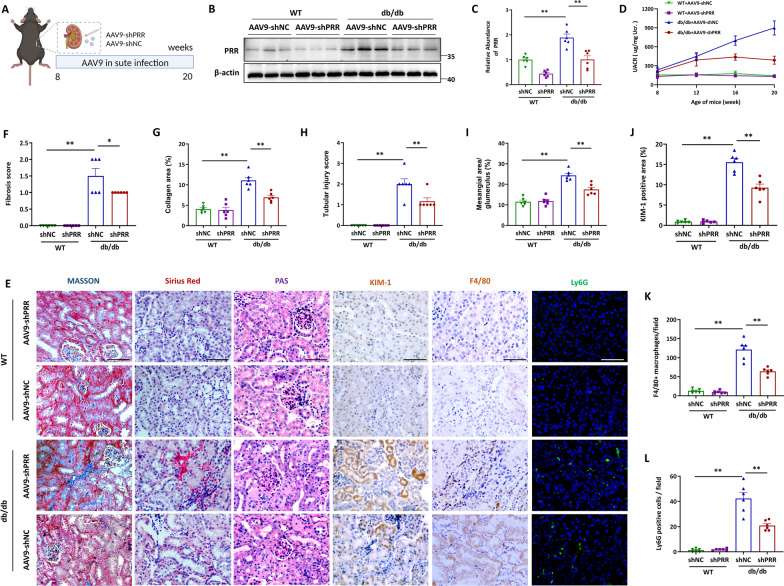
Fig. 7.
Silencing of PRR ameliorated kidney injury and inflammation in db/db mice. A Schematic diagram of the AAV injection surgery. B and C The protein level of PRR was assessed by Western blot. Representative Western blot (B) and quantitative data (C) are showed (n = 6). D Measured of urinary albumin concentration by using albumin detection kit, the quantitative data was normalized with urinary creatinine. E–L Representative images of Masson, Sirius Red, PAS, KIM-1, F4/80 and Ly6G staining of renal section of WT mice and db/db mice with or without PRR silence (E) and quantitative analysis (F–L) (n = 6). Bar = 20 μm. Data are presented as mean ± SEM of biologically independent samples. ∗ P < 0.05, ∗∗ P < 0.01. One-way ANOVA was used to analyze the data among multiple groups, followed by Tukey’s post hoc test

