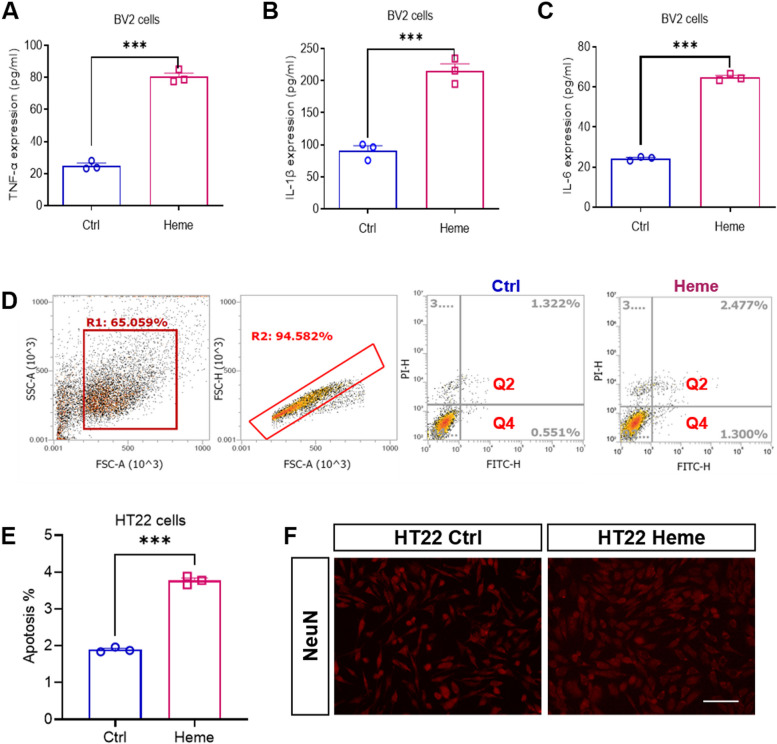
Fig. 3.
Hemin induced microglial inflammation and neuronal apoptosis. ELISA analysis of TNF-α A, IL-1β B and IL-6 C in BV2 cells after hemin treatment for 24 h. D The gating strategy and representative FACS plots of apoptotic cells (Q2 + Q4) in the control group and Heme group of HT22 cells. E Quantification of the percentage of apoptotic cells among HT22 cells in the control group and Heme group of HT22 cells. F Representative immunofluorescence images of neurons (red) in the control group and Heme group of HT22 cells. Scale bar = 100 μm. Data are presented as means ± SEM. ***p < 0.001

