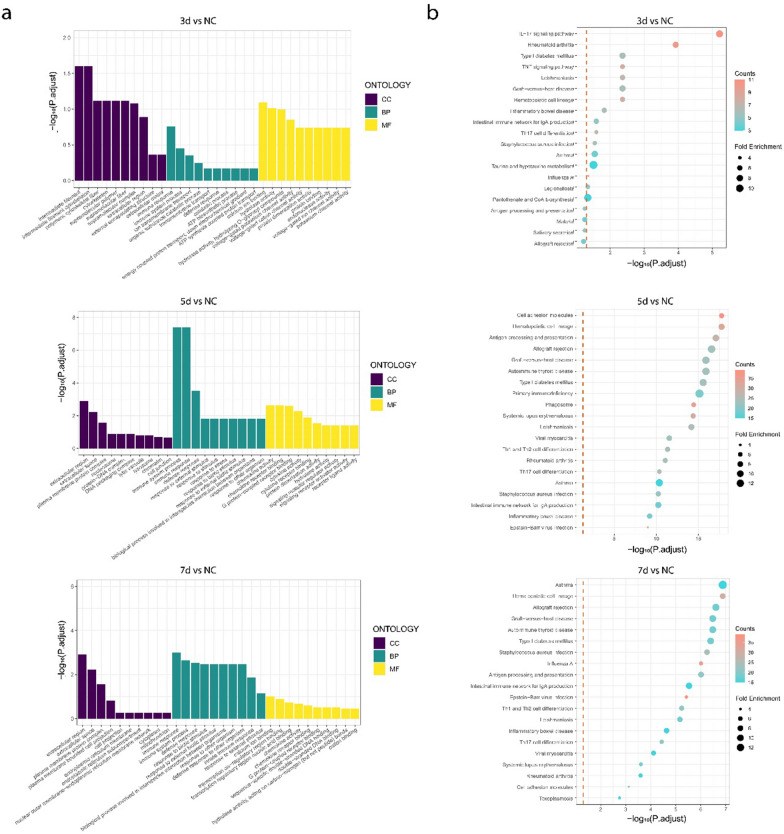
Fig. 4.
Go and KEGG enrichment maps of DEGs. a The picture shows the top ten entries (30 in total) in the three categories (biological process, cellular component, and molecular function) according to the adjust P value from large to small. Red, green, and blue represent the BP, CC, and MF, respectively. b According to the adjust P value and number of enriched mRNAs, the picture lists the top 20 pathway entries; the bubble color is red to blue, indicating that the adjust P value decreases, and the larger the bubble, the more mRNAs are enriched. GO, Gene Ontology; KEGG, Kyoto Encyclopedia of Genes and Genomes; DEMs, differentially expressed miRNAs; DEGs, differentially expressed genes; 3d, 3 days post infection; 5d, 5 days post infection; 7d, 7 days post infection; NC, negative control

