
Fig. 4. Abrasion resistance, stretchability, and biocompatibility of BASC films.
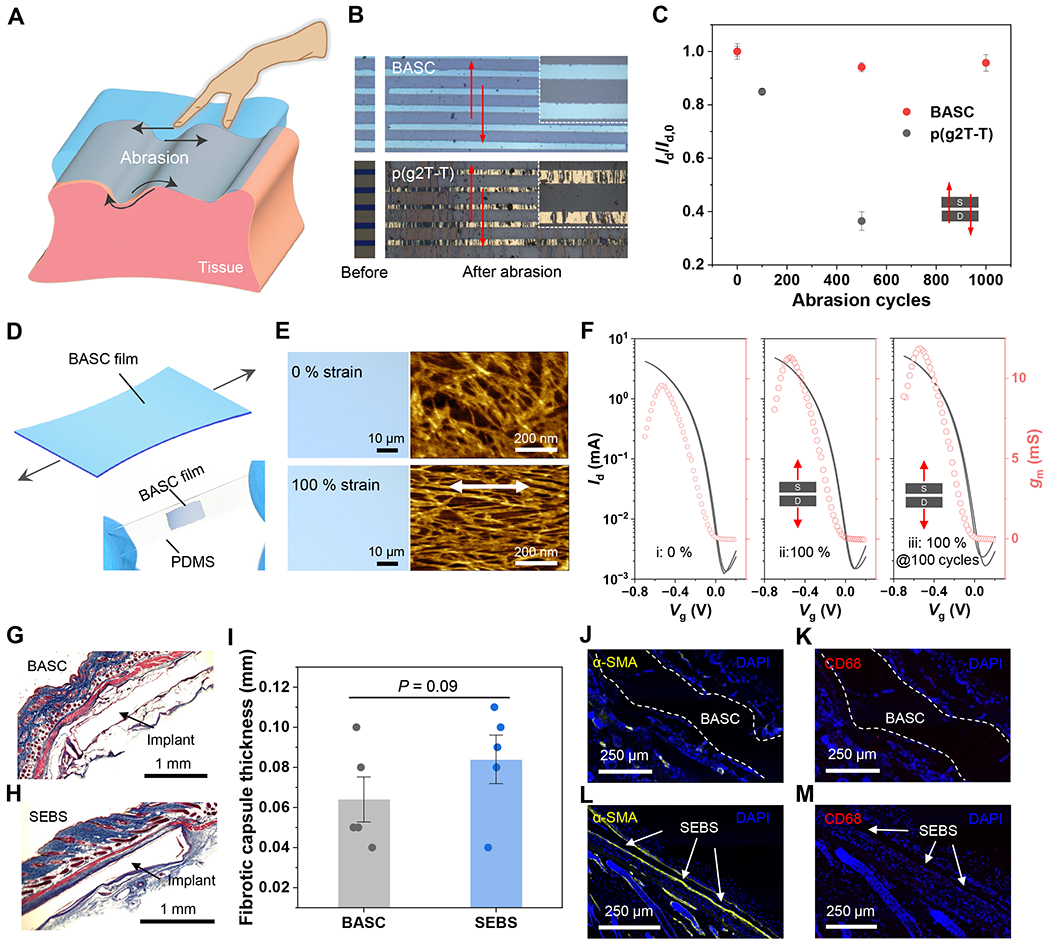
(A) Schematic diagram illustrating physical abrasions that can happen on the surfaces of implantable devices. (B) Photographs showing a BASC film and a p(g2T-T) film before and after abrasion by a PTFE-covered glass plate under 1 kPa for 500 cycles. The arrows indicate the direction of the abrasion. (C) Changes of OECT on-current from the two films after the abrasion cycles along the charge transport direction. Values represent the mean and the standard deviation (n = 4-5). (D) Schematic illustrating a BASC film under stretching. The bottom photograph shows a stretched BASC film on a PDMS substrate at 100 % strain. (E) Optical microscopy and AFM images showing a BASC film stretched to 100 % strain without forming cracks. (F) Transfer curves of BASC films in the pristine state, and stretched to 100 % strain for 1 and 100 cycles, which were measured with Vd = −0.6 V. (G to H) Masson’s trichrome staining of surrounded tissues of a subcutaneously implanted BASC film (G) and a SEBS film (control, H) after one month in mice. (I) Calculated fibrotic capsule thickness. (J to M) Immunofluorescence staining of α-SMA for fibroblasts (yellow, J and L) and CD68 for macrophages (red, K and M). Statistical significance and P values are determined by two-sided Student’s t-test: ns, not significant; **P<0.01.