
FIGURE 3.
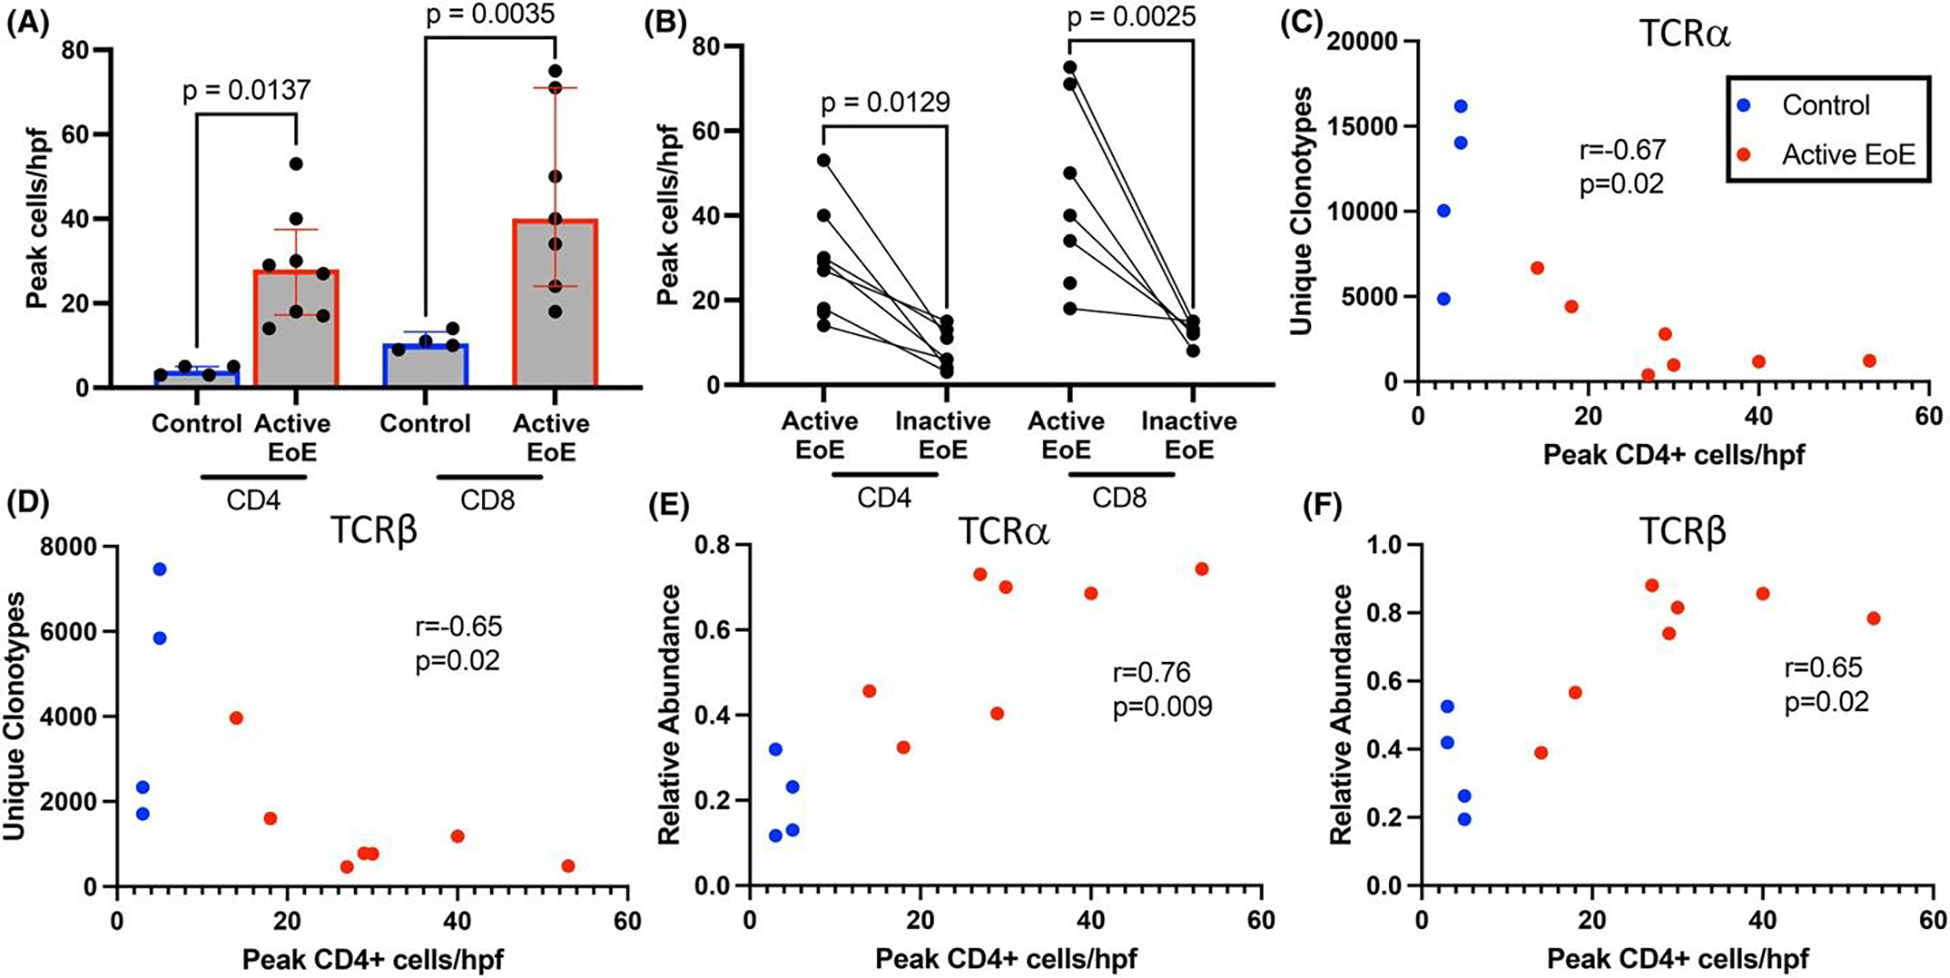
CD4 T-cells are increased in active EoE and correlate with measures of TCR clonality. Increased peak intraepithelial CD4 and CD8 T-cells per (400x) high power field (hpf) in active EoE compared to control (A) and inactive EoE (B). At least 3 hpfs were assessed per biopsy. Comparison by one-way ANOVA with Bonferroni post hoc. Spearman correlation of CD4+ cells per hpf with unique clonotypes for TCRα (C) and TCRβ (D) and relative abundance of TCRs comprising >1% of the total for TCRα (E) and TCRβ (F).