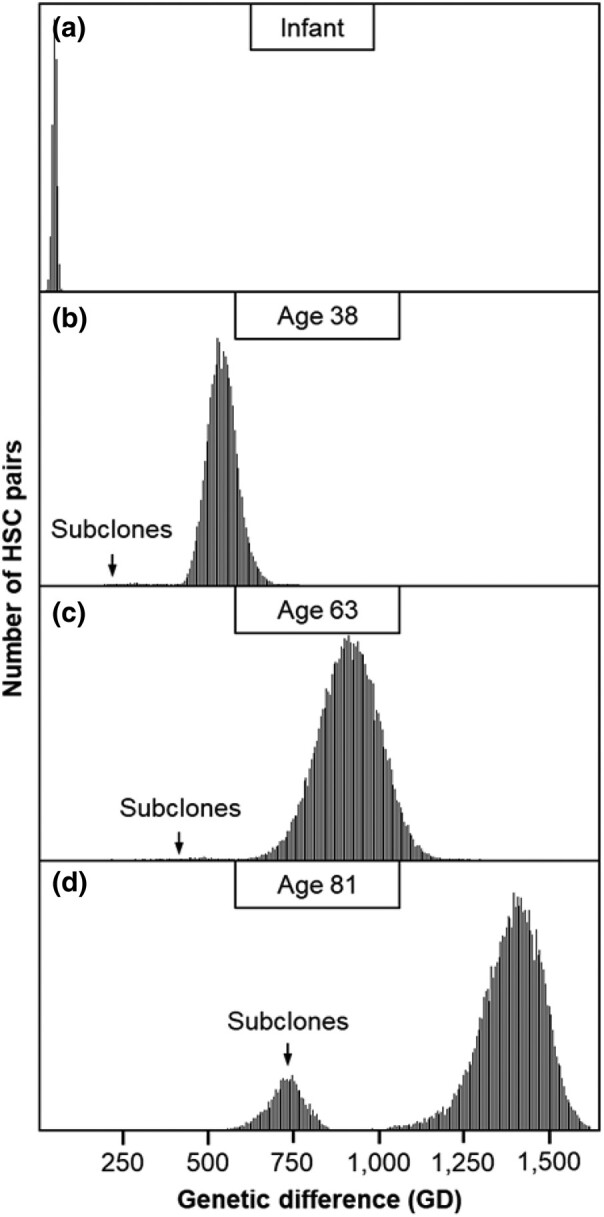
Fig. 2.

Distributions of GDs between HSCs. Distributions are shown for a) an infant, b) a 38-yr-old, c) a 63-yr-old, and d) an 81-yr-old. Subclones arising from later in life are marked by an arrow, which forms a tail or a distribution to the left of the primary peak corresponding to the HSCs that arose during embryogenesis.
