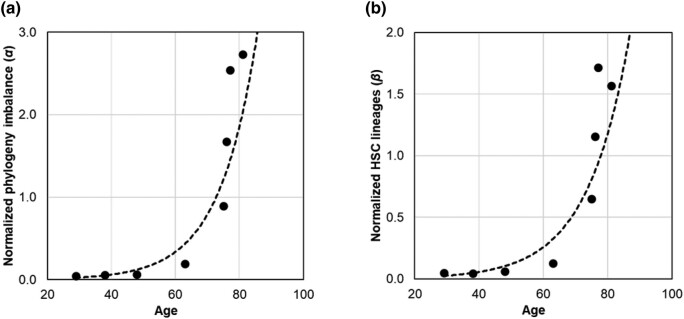
Fig. 6.
The relationship of phylogenetic diversity decay metrics with age and age-related cancer risk. a) Normalized phylogeny imbalance (α) in HSC phylogenies from healthy individuals increases following an exponential function: α = 0.002×e0.09×age (R2 = 0.89). b) Normalized HSC lineage count (β) increases following an exponential function: β = 0.003×e0.08×age (R2 = 0.87).

