Fig. 7.

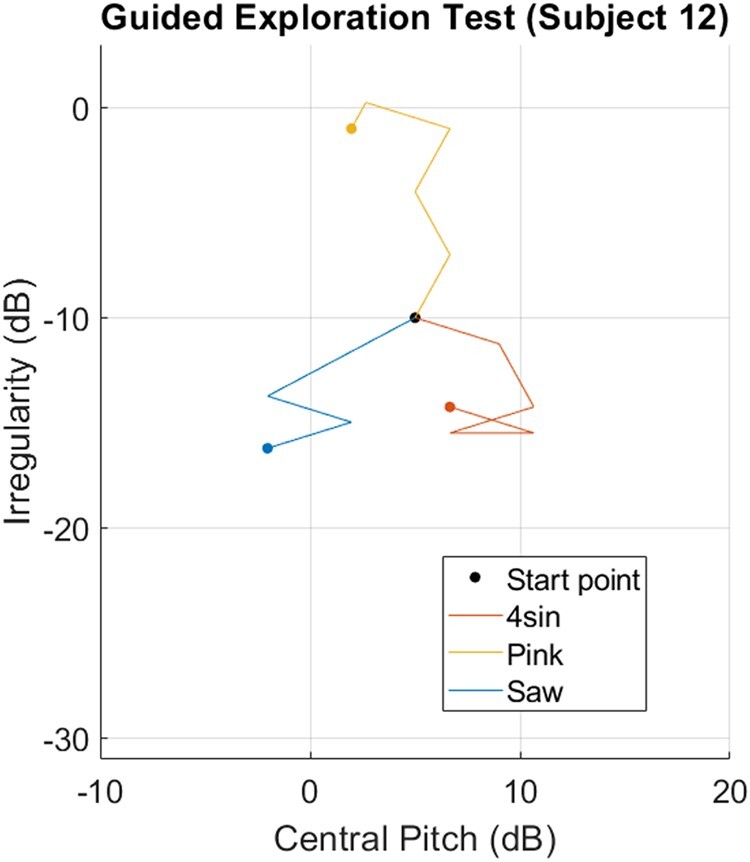
Guided Exploration test results for one subject. Lines connect subspace centroids throughout the optimization algorithm’s progress (line directions match that of the Pursuit Vector for each trial) and solid dots indicate termination points.

Guided Exploration test results for one subject. Lines connect subspace centroids throughout the optimization algorithm’s progress (line directions match that of the Pursuit Vector for each trial) and solid dots indicate termination points.