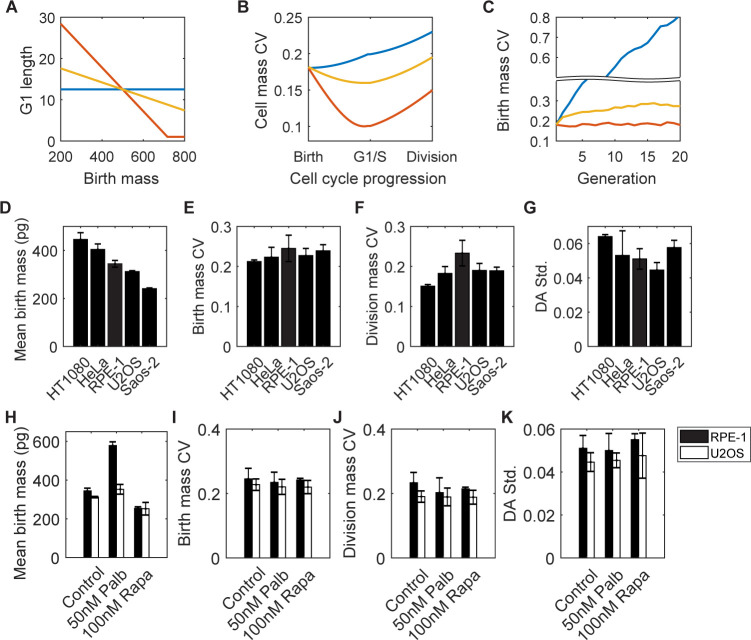
Fig 1. Cell mass variation is tightly controlled in mammalian cell lines and is robust to perturbations in G1/S regulation or growth rate.
(A–C) An abstract model of cell mass homeostasis at different G1 regulation strengths, represented by the slope of G1 length vs. birth mass correlation. The corresponding model and simulation parameters are in the Section 1 in S1 Text. In the model, we assume cells grow exponentially, and the G1 length control is the only mechanism to reduce cell mass variation. (A) Correlations between G1 length and birth mass. Blue: no G1 length control; red: with strong G1 length control; yellow: with weak G1 length control. (B) Cell mass CV changes with cell cycle progression during 1 cell cycle with the corresponding G1 length regulation in (A). (C) Birth mass CV changes across generations with the corresponding G1 length regulation in (A). (D–G) The mean birth mass (D), birth mass CV (E), division mass CV (F), and DA std. (G) for different cell lines. (H–K) The mean birth mass (H), birth mass CV (I), division mass CV (J), and DA std. (K) for RPE-1 and U2OS cells in normal culture medium, medium with 50 nM palbociclib, and medium with 100 nM rapamycin at cell mass homeostasis. Error bars in (D–K) indicate the standard deviation of 3 or more measurements. The data underlying this figure and the scripts used to generate the plots are available on the Open Science Framework at osf.io/3kyvw. CV, coefficient of variation; DA std., standard deviation of Division Asymmetry.

