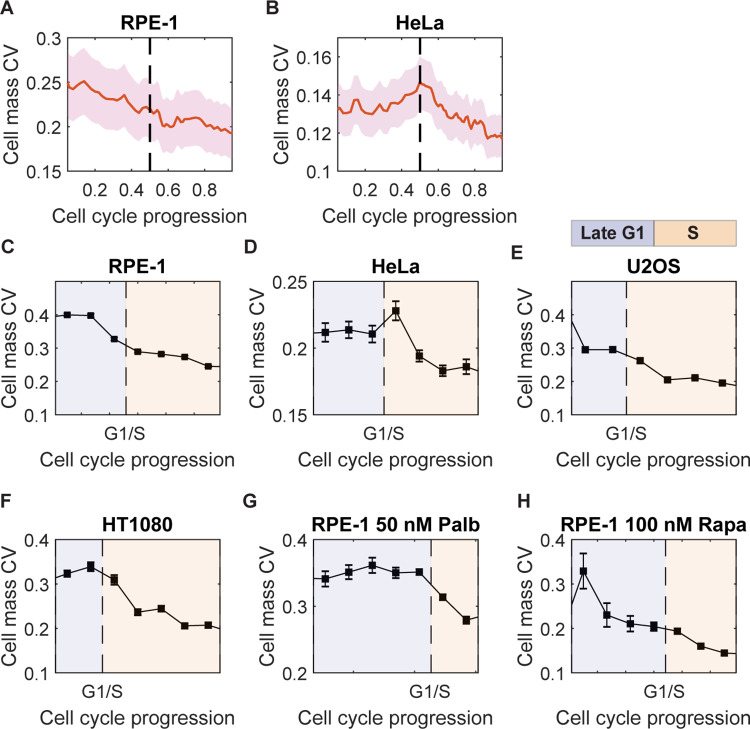
Fig 2. Cell mass variation is regulated throughout the cell cycle.
(A, B) Cell mass CV change with cell cycle progression measured in live RPE-1 (n = 89) (A) and HeLa cells (n = 223) (B). The red solid lines denote the cell mass CV of the population; the pink shadows show the 95% confidence interval; the dashed line indicates the G1/S transition. (C–H) The profiles of how cell mass CV changes with cell cycle progression at cell mass homeostasis measured in fixed RPE-1 (C), HeLa (D), U2OS (E), and HT1080 (F) cells, as well as RPE-1 cells that had reached the new cell mass homeostasis with 50 nM palbociclib (G) or 100 nM rapamycin (H). The cell cycle stages were identified by DNA content and log(mAG-hGeminin) as illustrated in S4B–S4F, S4H, and S4J Fig; the late G1 and S phases are indicated by areas shaded in purple and orange, respectively; error bars are the standard error of CV, (), where n is the cell number at the corresponding cell cycle stage (n > 135 for all conditions). The data underlying this figure and the scripts used to generate the plots are available on the Open Science Framework at osf.io/3kyvw. CV, coefficient of variation.

