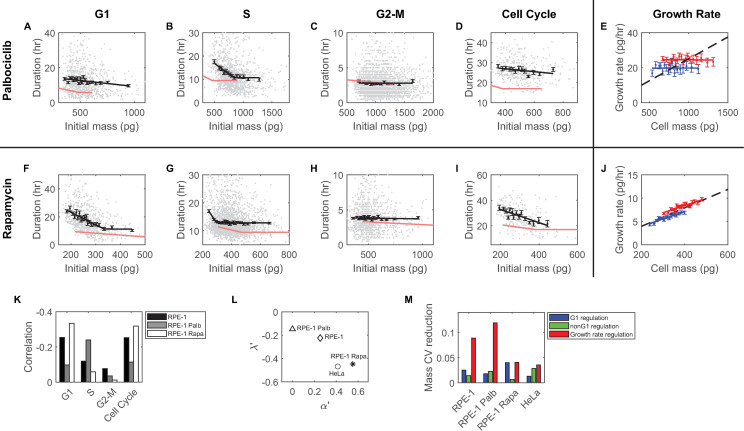
Fig 5. The compensatory roles of mass-dependent cell cycle regulation and mass-dependent growth rate regulation in maintaining cell mass homeostasis.
(A–D) The correlations between the lengths of the G1 (A), S (B), G2-M phases(C), and the full cell cycle (D) and the initial mass of the corresponding period in RPE-1 cells treated with 50 nM palbociclib. Each gray dot is an observation; black squares indicate the average of each cell mass bin; error bars are SEM; solid black line is the best fit of the black squares; solid red lines are the corresponding correlations in untreated RPE-1 cells. (E) Correlations between cell mass and growth rate in the G1 (blue) and nonG1 (red) phases for RPE-1 cells treated with 50 nM palbociclib. Filled squares represent the median growth rate of each bin; error bars show SEM. The black dashed lines indicate the expected behavior for exponential growth. The solid blue and red lines are the best fit of the filled squares. (F–I) The correlation between the lengths of the G1 (F), S (G), G2-M phases (H), and the full cell cycle (I) and the initial mass of the corresponding period in RPE-1 cells treated with 100 nM rapamycin. (J) Correlations between cell mass and growth rate in the G1 (blue) and nonG1 (red) phases for RPE-1 cells treated with 100 nM rapamycin. (K) Kendall rank correlations between the duration of indicated cell cycle phase and cell mass at the initiation of the respective phase, in untreated RPE-1 cells, RPE-1 treated with 50 nM palbociclib, and RPE-1 treated with 100 nM rapamycin. (L) The correlation between the normalized slope of birth mass vs. cell cycle length correlation, λ′, and the normalized slope of cell mass vs. growth rate correlation, α′, depicted for untreated HeLa and RPE-1 cells, as well as RPE-1 cells treated with palbociclib or rapamycin. The values of λ′ and α′ used in this plot are listed in S7 Table. (M) The contribution of each control mechanism shown as the reduction in the simulated division mass CV when the respective control mechanism is included compared to that without any control mechanisms. Simulation parameters were obtained from experimental data measured in untreated HeLa and RPE-1 cells, as well as RPE-1 cells treated with palbociclib or rapamycin. The data underlying this figure and the scripts used to generate the plots are available on the Open Science Framework at osf.io/3kyvw. CV, coefficient of variation; SEM, standard error of the mean.

