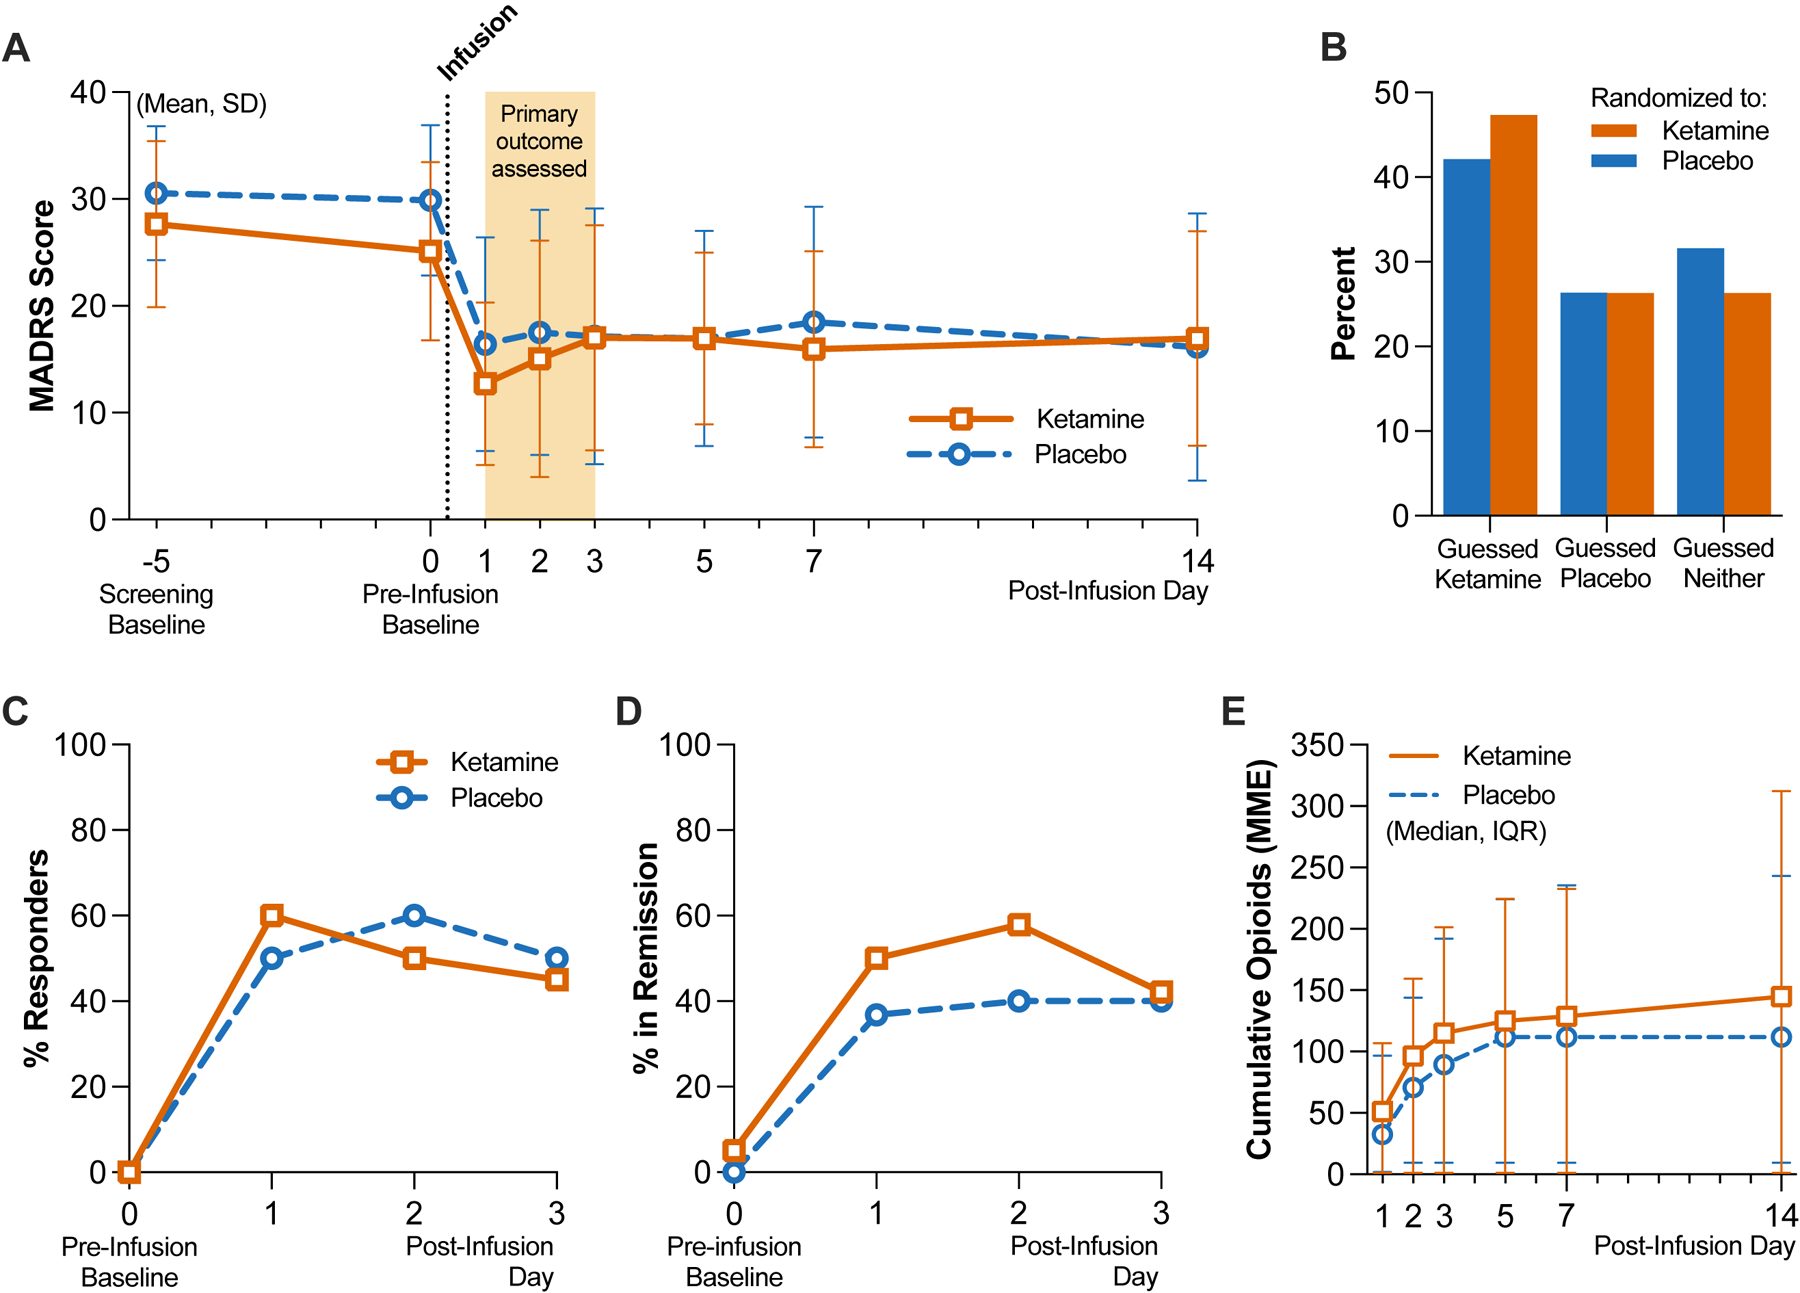
Figure 2. Depression Severity, Masking Assessment and Other Outcomes.

Panel A shows the mean and standard deviation (SD) scores by group on the Montgomery-Åsberg Depression Rating Scale (MADRS; scores range from 0 to 60, with higher scores indicating greater depression); the screening baseline visit occurred on average 5 days before infusion on day 0. Total N=39 independent participant responses per day, on post-infusion days 1 through 3 (see Extended Data Table 1 for group-specific counts). Panel B shows the distribution of guesses as a percentage of each group (n=19 per group) made by participants when asked to guess which treatment they received after the last follow-up visit. Panel C shows the difference in MADRS scores relative to pre-infusion baseline scores obtained on day 0 (same sample size as reflected in Panel A). Panels D shows the proportions of clinical response, respectively as a percentage of each group (n=20 per group), within the first 3 days. Panel E shows the cumulative opioid consumption in MME by group, represented as median and interquartile range (IQR); both inpatient and outpatient opioids were included in the total (n=20 per group).
