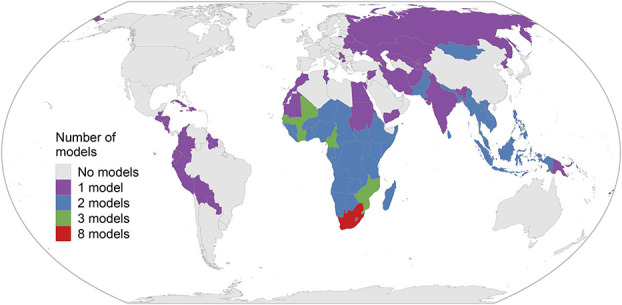
FIGURE 1.

World map of countries for which model-based estimates of the infection ratios were used for our analysis. Colors represent the number of transmission-dynamic models that had simulated the HIV epidemic in the country and included at least 1 KP and their sexual partners and were available for this analysis.
