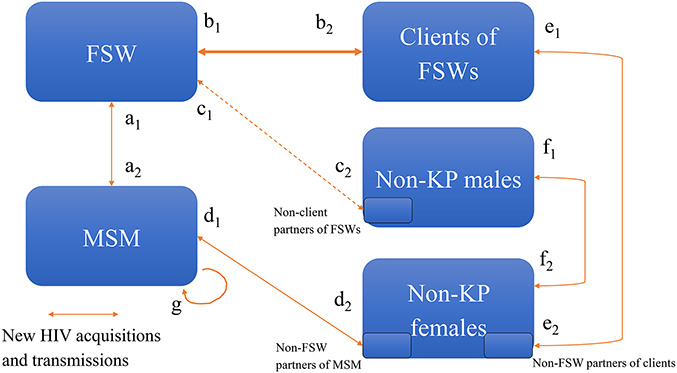
FIGURE 2.

Simplified diagram of the number of new HIV acquisitions/transmissions occurring over a year between commonly modeled risk groups (large blue boxes). Several models (n = 7) represented intermediate-risk non-KP populations (eg, men reporting many stable or casual partners but not having paid for sex), but none of the models explicitly represented non-KP partners of KPs (small light blue boxes). Therefore, the ratios of new HIV infections among clients and partners of FSWs over the ones of FSWs in 2020 were first calculated using approach A, which considers the number of acquisitions by FSW clients in the numerator , and/or the approach T based on direct transmissions in some models (eg, ratio of for clients and non-KP partners of FSW), or on counterfactual scenarios without transmission from a specific group to their non-KP partners over 2020 () for clients and partners of FSW, for cisgender female partners of MSM, or for non-KP partners of FSW clients, which subsequently reduces the number of secondary transmissions over that year. The approach A could only be used for clients and non-KP partners of FSW, which most models distinguish as a default group, whereas the models do not explicitly distinguish non-KP partners of other KP (represented here by small blue boxes). The line between c1 and c2 is dashed because a third of models assume no partnerships between FSWs and non-KP males.
