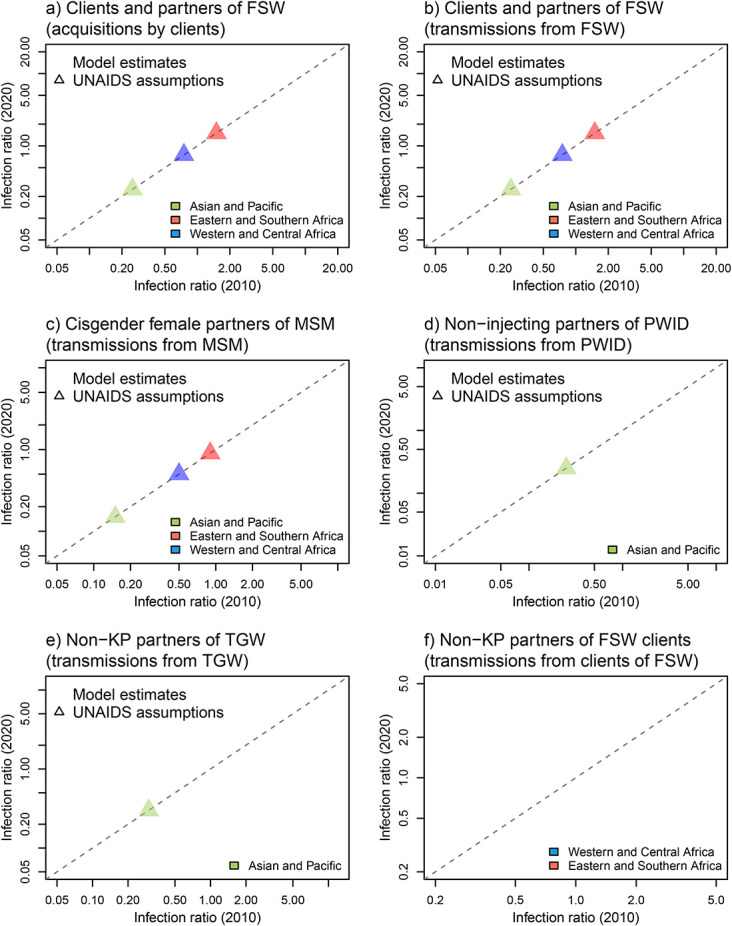
FIGURE 3.

Comparison of infection ratio estimates over the years 2010 and 2020 for (A) clients and non-KP partners of FSW (using the number of infections acquired by FSW clients), (B) clients and non-KP partners of FSW (using the number of infections transmitted by FSW), (C) cisgender female partners of MSM, and non-KP partners of (D) PWID, (E) TGW, (F) clients of FSW, in the Asia and Pacific region (green), Western and Central African region (blue), and Eastern and Southern African region (red). Colored dots represent model estimates, whereas triangles correspond to 2022 UNAIDS assumptions for 2021 (assumed similar to 2010 because they do not’ include a time dimension). Estimates shown in the figures are those that were available for both 2010 and 2020, thus estimates from Goals 2022 and Goals GF (only available for 2020) are not shown. The dashed diagonal line indicates perfect agreement between 2010 and 2020 estimates.
