Figure 1.

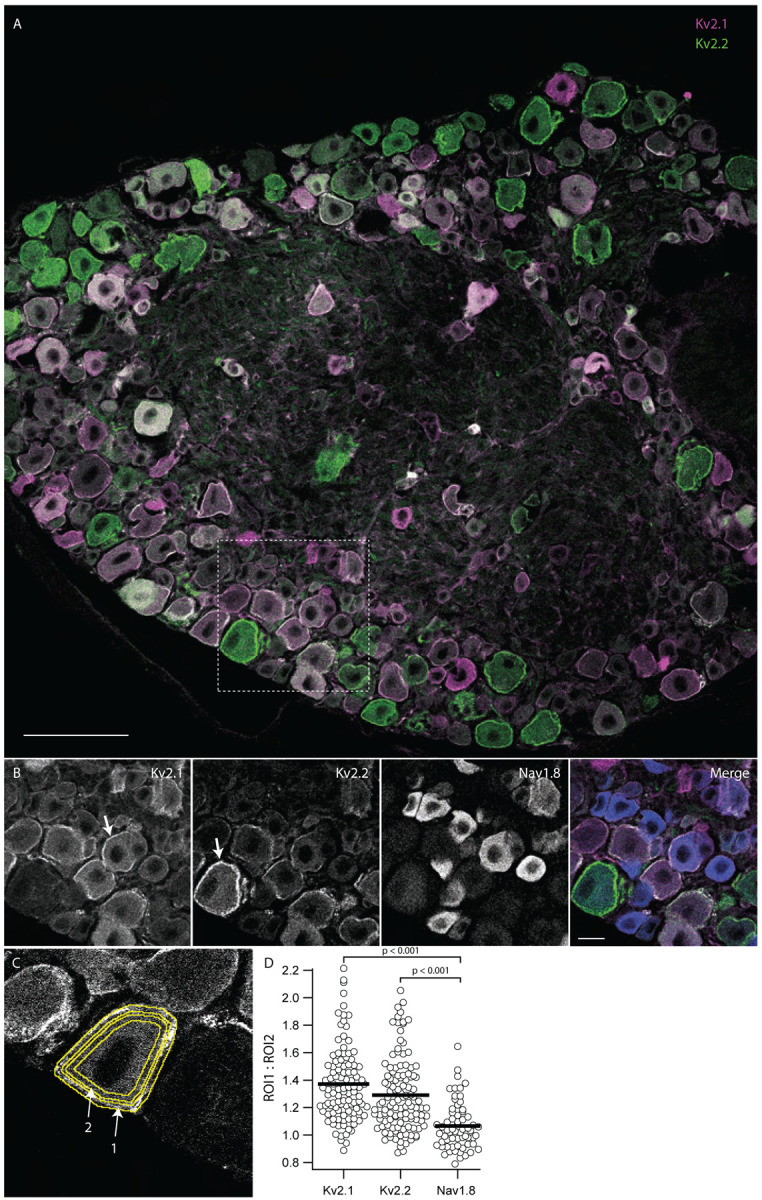
Kv2.1 and Kv2.2 protein are enriched at the outer edge of DRG neuron somas relative to Nav1.8. Lumbar DRG section from an 11 week old male mouse labeled with antibodies which target Kv2.1, Kv2.2 or Nav1.8. A, Anti-Kv2.1 (magenta) and anti-Kv2.2 (green) immunofluorescence in a lumbar DRG section. Scale bar is 100 μm. B, Anti-Kv2.1, anti-Kv2.2 and anti-Nav1.8 immunofluorescence from box shown in A. Arrows indicate prominent localization of anti-Kv2 immunofluorescence at the edge of DRG neuron somas. In merge image anti-Kv2.1, anti-Kv2.2 and anti-Nav1.8 immunofluorescence is magenta, green and blue respectively. Scale bar is 20 μm. C, Representative ROIs that encompass the outer edge of DRG neurons (arrow 1) and the region just inside the outer edge (arrow 2). D, Ratio of anti-Kv2.1, anti-Kv2.2 or anti-Nav1.8 immunofluorescence from outer and inner ROIs for individual neurons from image in A. Bars represent mean. One-way ANOVA p < 0.001. p values in figure represent post hoc Tukey’s test. N = 1 mouse, n = 124 neurons. Detailed information on mouse used can be found in table 1.
