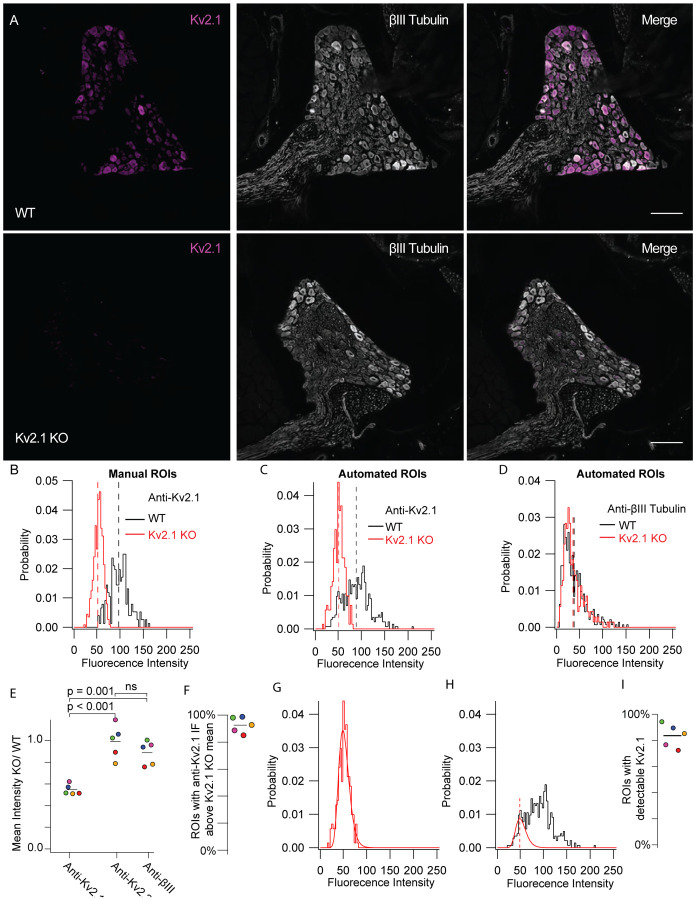
Figure 2.
Kv2.1 protein is detectable in mouse DRG neurons. A, WT (top) and Kv2.1 KO (bottom) DRG sections taken from 7 week old female mice from the 13th thoracic DRG immunolabeled for Kv2.1 (magenta) and BIII tubulin (white). Images were taken with identical imaging settings and are set to the same brightness and contrast. Scale bars are 100 μm. B, Distribution of fluorescence intensity from manual analysis of WT (black) and Kv2.1 KO (red) neurons. Dotted lines represent mean. Data represent fluorescence intensity of 254 WT profiles from 10 DRG sections from 1 mouse or 375 Kv2.1 KO profiles from 5 DRG sections from 1 mouse. Images shown in A represent one section from WT and Kv2.1 KO mice used in this data set. C, Distribution of fluorescence intensity from automated analysis of the same data set shown in B. Dotted lines represent mean. Data represent fluorescence intensity of 476 WT or 576 Kv2.1 KO profiles selected by automated analysis method. D, Distribution of BIII tubulin fluorescence intensity from the same WT (black) and Kv2.1 KO (red) profiles shown in C. Dotted lines represent mean. E, Mean fluorescence intensity of Kv2.1 KO neurons normalized to WT neurons labeled with anti-Kv2.1, anti-Kv2.2 and anti-BIII tubulin antibodies. Each point represents one Kv2.1 KO mouse normalized to one age and sex matched WT mouse which was stained simultaneously and imaged with identical microscopy settings. The color of each point represents the same mouse and purple points represent data from the mouse whose DRG immunofluorescence data are shown in A, B, C and D. one-way ANOVA p < 0.001. p values in figure represent post hoc Tukey’s test. F, Percentage of ROIs with anti-Kv2.1 immunofluorescence above the mean immunofluorescence of 5 mice (1 female and 4 male). Point colors correspond to the WT mice analyzed in E. All mice were compared to age and sex matched Kv2.1 KO mice. N = 5 WT and 5 Kv2.1 KO mice. G, Kv2.1 KO data shown in B fit with a log normal distribution (red fit). H, WT data shown in B fit with the Kv2.1 KO distribution (red fit) where width and mean were constrained to the Kv2.1 KO distribution and amplitude was unconstrained (equation 1). Red dotted line represents the mean of the Kv2.1 KO distribution. Only WT data to the left of red dotted line was used for the fit. I, Percentage of ROIs with detectable Kv2.1 protein of 5 mice (1 female and 4 males). Point colors correspond to the WT mice analyzed in E. All mice were compared to age and sex matched Kv2.1 KO mice. N = 5 WT and 5 Kv2.1 KO mice. Detailed information on each mouse used can be found in table 1.

