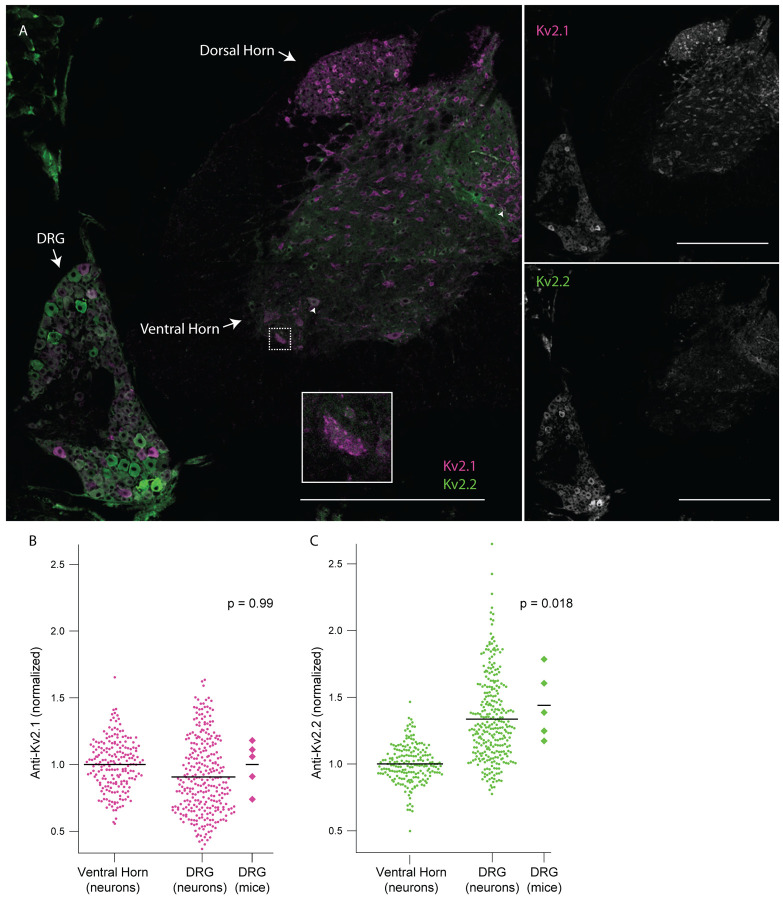
Figure 6.
DRG neurons have enriched Kv2.2 protein compared to neurons in the spinal cord. A, Anti-Kv2.1 (magenta) and anti-Kv2.2 (green) immunofluorescence in a spinal cord section from the 2nd lumbar vertebra (left). Anti-Kv2.1 immunofluorescence (right top) and anti-Kv2.2 immunofluorescence (right bottom). Arrows show neurons in the spinal cord with punctate anti-Kv2.1 immunofluorescence. Arrow heads show neurons in the spinal cord with anti-Kv2.2 immunofluorescence. Scale bars are 500 μm. B, Anti-Kv2.1 immunofluorescence from individual neuron profiles (circles) from multiple mice in the DRG and ventral horn normalized to the average fluorescence intensity of neuron profiles in the ventral horn. Diamonds to the right of data represent the average intensity of individual mice. Significant differences from 1 were calculated for individual mice using Students t-test. N = 5 mice, n = 295 in DRG and n = 200 in ventral horn. Detailed information on each mouse used can be found in table 1. C, Identical analysis as in panel B but with anti-Kv2.2 immunofluorescence.

