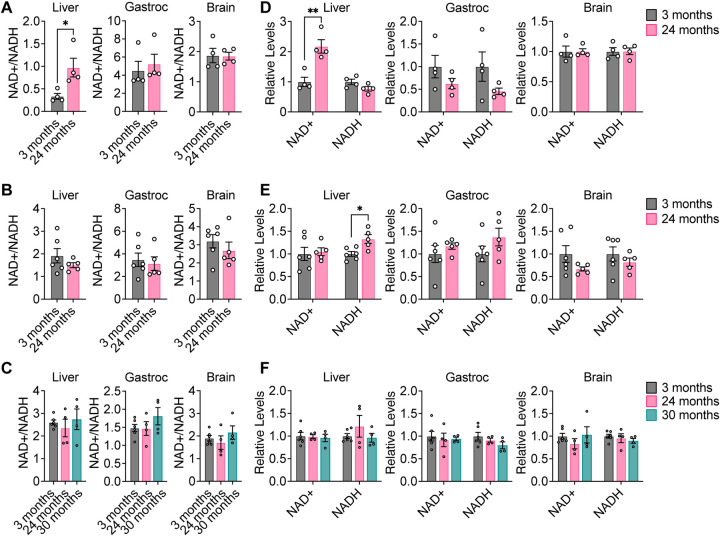
Figure 4. NAD+, NADH, and NAD+/NADH do not significantly change with healthy aging in mouse tissues.
A–C, NAD+/NADH ratios in liver, gastrocnemius muscle, and brain tissues from young versus old C57BL/6J (A), WSB/EiJ (B), and DO (C) mice. D–F, Relative levels of NAD+ and NADH in in liver, gastrocnemius muscle, and brain tissues from young versus old C57BL/6J (D), WSB/EiJ (E), and DO (F) mice. C57BL/6J: 3 months n = 4, 24 months n = 4. WSB/EiJ: 3 months n = 6, 24 months n = 5. DO: 3 months n = 6, 24 months n = 4, 30 months n = 4. Data are presented as mean ± SEM. Comparisons were made using a two-tailed Student’s t-test.

