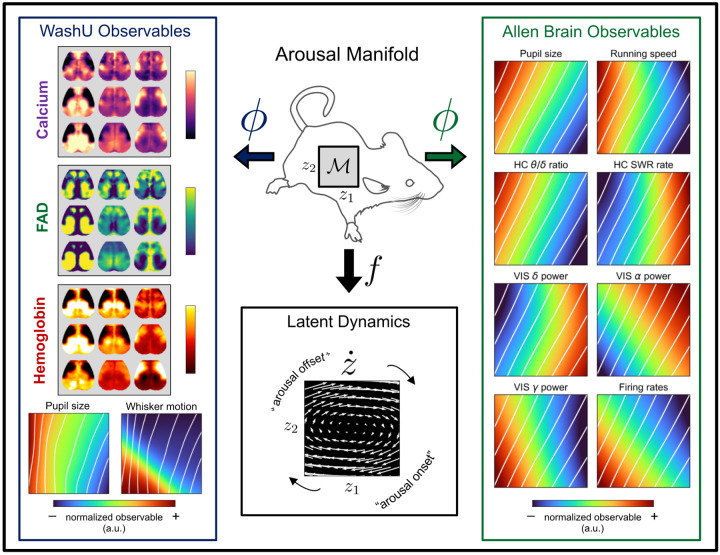
Figure 4: Unifying observables through arousal dynamics.
Our framework distinguishes recorded observables from their lower-dimensional, latent generative factors. This enables a systems-level characterization of arousal that readily accommodates new measurement data. For visualization purposes, pupil delay coordinates were reduced to two latent factors z1 and z2, providing a 2D parameterization of the manifold. From a sample grid of points, we used the discovered observation functions (i.e., decoders ϕ) to evaluate the expected value of each observable at each point on the manifold. This procedure was repeated for the observations recorded from animals at Washington University (WashU) and those recorded through the Allen Brain Observatory. In each case, the results shown were averaged over mice for presentation (see Fig. S7 for quantification in individual mice). White diagonals are iso-contours of pupil diameter. Estimation of the vector field at each point (via a data-driven analytical approximation of the dynamics [76]) clarifies the average direction of flow along the manifold (“Latent Dynamics”). This vector field characterizes cyclical (clockwise) flow of the latent arousal dynamics (governed by f), while the “observable” plots can be used to infer how this evolution would manifest in the space of each physical observable (given by ϕ).

