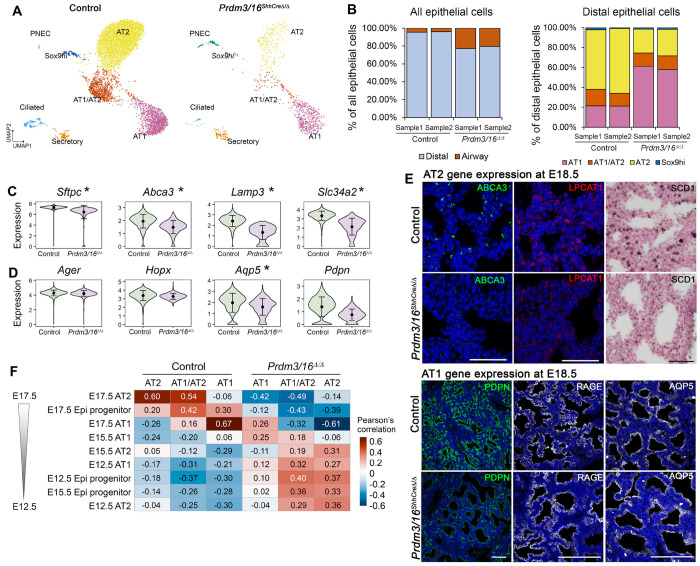
Figure 2. Single-cell RNA-seq (scRNA-seq) analysis of cellular and gene expression alterations in Prdm3/16ShhCreD/D mouse lung at E18.5.
(A) UMAP plots of mouse epithelial cell subsets. (B) Alterations in cell type proportions within all epithelial (left panel) and within distal epithelial (right panel) cells. scRNA-seq data of epithelial cells in (A) were used for the cell type proportion calculations. (C) Violin plot visualization of representative AT2 associated RNAs. (D) Violin plot visualization of representative AT1 associated RNAs. In (C&D), black dots and error bars represent mean±SD; * represents p-value of two-tailed Wilcoxon rank sum test ≤0.05, fold change ≥1.5, and expression percentage ≥20%. (E) Immunofluorescence staining of differentially expressed AT1 and AT2 genes in E18.5 lungs (F) Pseudo-bulk correlation analysis with an independent mouse lung developmental time course scRNA-seq data (GSE149563) showing that alveolar epithelial cells from Prdm3/16ShhCreΔ/Δ mouse lungs are most similar to cells from earlier time points.

