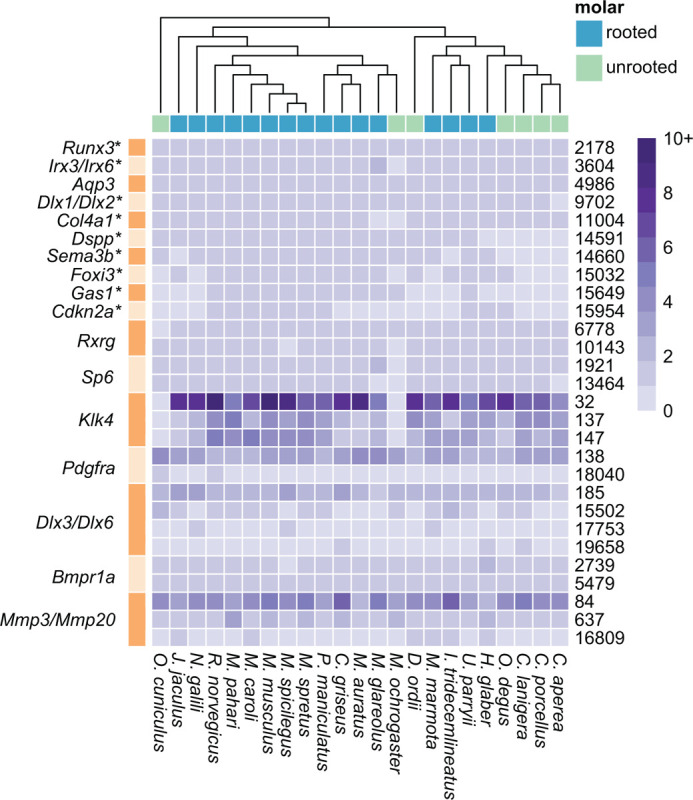
Figure 2 –

Heatmap showing the number of genes per species (inset gradient scale from 0 to 10+) in each synteny cluster. The figure shows clusters where species with unrooted molars had no representation or did not have sequences in all microsynteny clusters associated with a single gene, clusters where more than one gene mapped to the same cluster, or a single gene mapped to multiple clusters. Microsynteny cluster number is noted on the right side of the heatmap (one row per cluster), and corresponding genes are noted on the left with alternating bands showing rows to which those genes mapped. * = genes where hierarchical orthogroup did not contain genes for all 23 species. We found little evidence that non-syntenic genes in species with unrooted molars are undergoing selection for novel functions.
