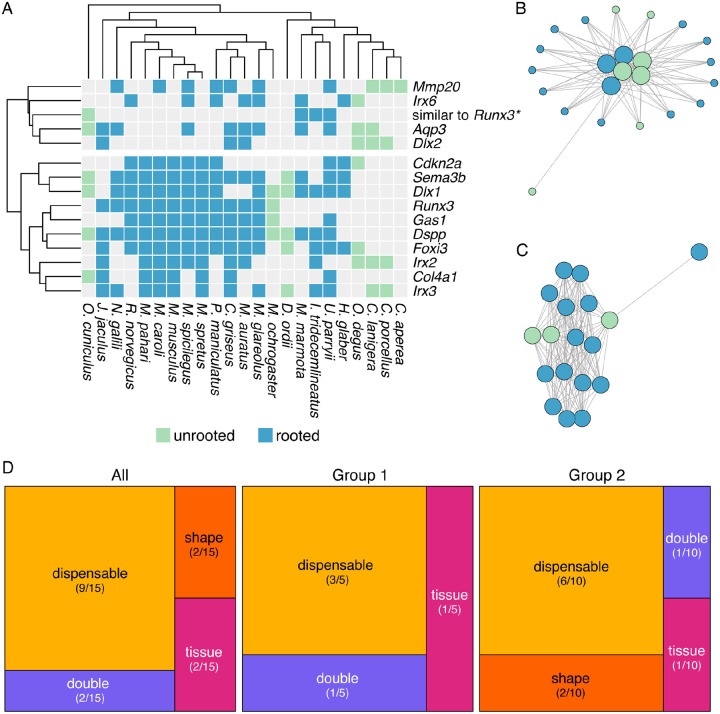
Figure 2 –
A Presence (colored boxes) or absence (gray boxes) of gene sequences for each species in hierarchical orthogroups where fewer than half of the species with unrooted molars had conserved synteny. Columns are ordered according to phylogenetic positions (top) and rows are ordered by Euclidean distance clustering. Rows are split into two major groups: group 1, in which synteny is not conserved across Glires, and group 2, in which synteny is not conserved mainly in species with unrooted molars. * = One hierarchical orthogroup represented only four gene sequences annotated based on similarity to Runx3. B An example of a synteny network for genes in Group 1, displayed using the Fruchterman-Reingold layout algorithm in the R package iGraph (142). Small circles represent genes in the synteny network that are not part of the hierarchical orthogroup, large circles represent genes in the hierarchical orthogroup, and lines between circles represent a syntenic relationship between two species. Circle color represents whether species has rooted or unrooted molars following the same key in A. C An example synteny network for genes in Group 2, displayed using the Fruchterman-Reingold layout algorithm in the R package iGraph (142). Circles represent genes in the hierarchical orthogroup, and lines between circles represent a syntenic relationship between two species. Circle color represents whether species has rooted or unrooted molars following the same key in A. D Treemaps representing the keystone gene categories for all hierarchical orthogroups, the Group 1 hierarchical orthogroups, and the Group 2 hierarchical orthogroups. Most genes in each group are in the “dispensable” keystone gene category, which includes genes that are dynamically expressed during dental development but have no documented effect on phenotypes.

