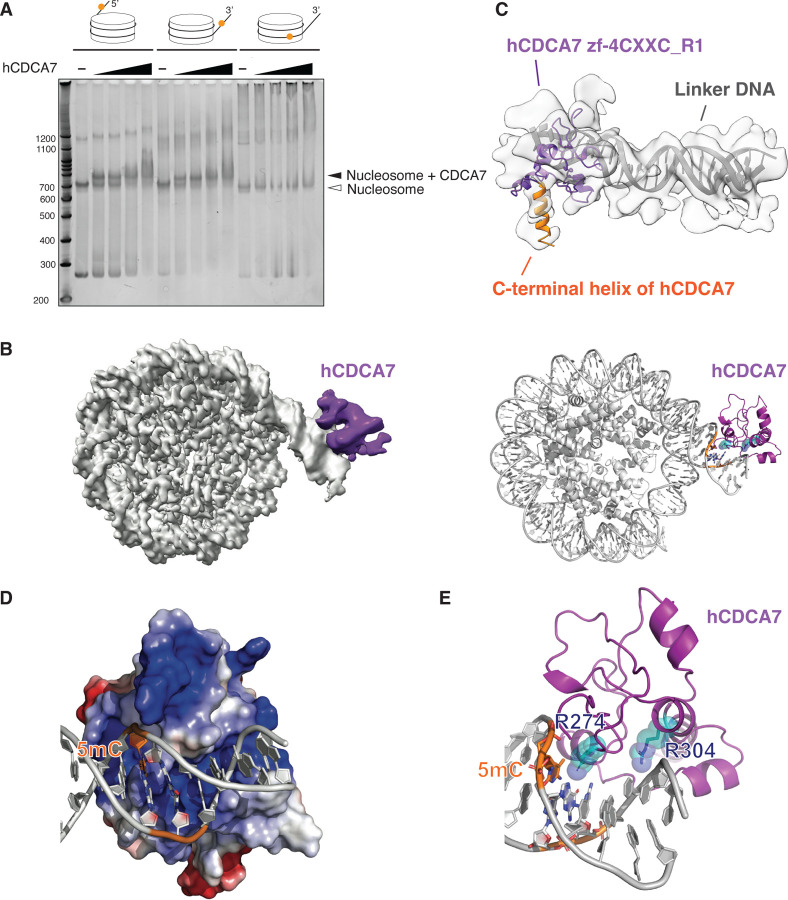
Fig. 3: Cryo-EM structure of hCDCA7:nucleosome complex.
(A) Native gel electrophoresis mobility shift assay analyzing the interaction of hCDCA7264–371 C339S with nucleosomes. (B) A composite cryo-EM map (left) and the model structure of hCDCA7264–371 C339S (generated from AF2) bound to nucleosome harboring a hemimethylated CpG at the 3’-linker DNA (right). The map corresponding to CDCA7 is colored purple. (C) Overlay of AF2 model of hCDCA7264–371 C339S on the cryo-EM map. (D) Electrostatic surface potential of hCDCA7264–371, where red and blue indicate negative and positive charges, respectively. Linker DNA is depicted in gray, orange indicates the location of 5-methylcytosine (5mC). (E) A model structure of hCDCA7264–371 C339S bound to 3’-linker DNA. ICF mutation residues, R274 and R304, are shown as cyan stick model superimposed on a transparent sphere model.

