
Figure 2: Host phylogeny of S. cerevisiae annotated with the presence or absence of Ty4/Tsu4 subfamilies.
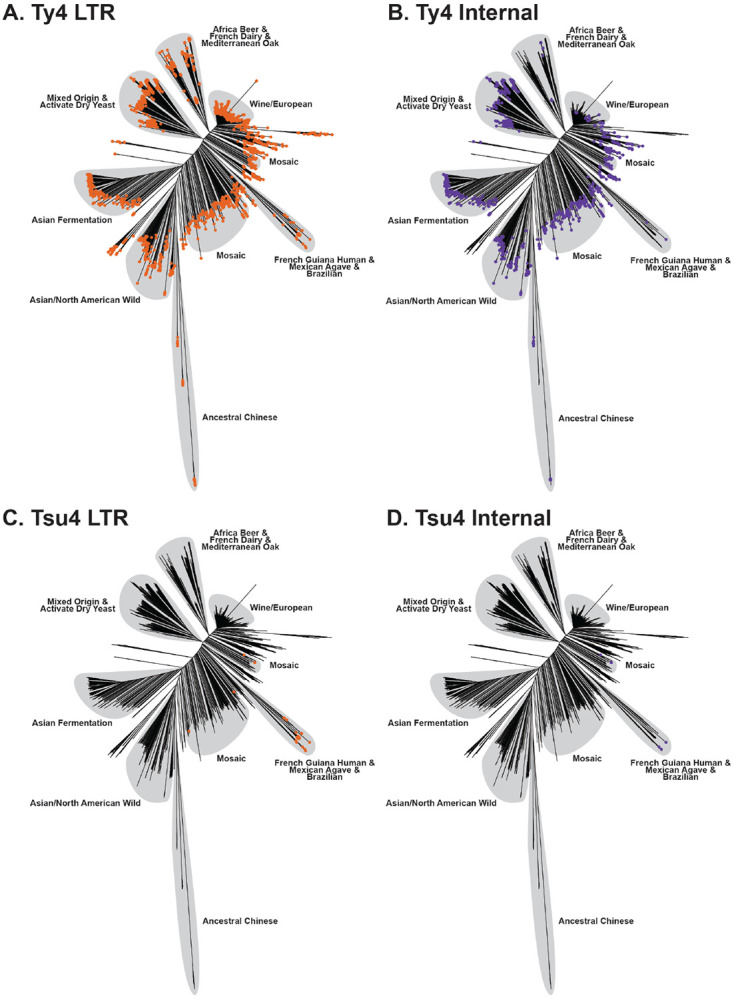
(A-D) NJ phylogenetic tree reconstructed using 2,787,577 genome-wide SNPs from 2,404 S. cerevisiae strains (see Materials and Methods). Major lineages are annotated with light gray shading based on previously-reported population structure (Peter et al., 2018; Duan et al., 2018). Colored dots indicate the presence of Ty4 (panels A and B) and Tsu4 (panels C and D) sequences for each S. cerevisiae strain. The presence of Ty4/Tsu4 subfamilies in a strain was inferred when copy number estimates were >1 for LTRs (annotated with orange dots in panel A and C) and >0.5 for internal regions (annotated with purple dots in panel B and D).