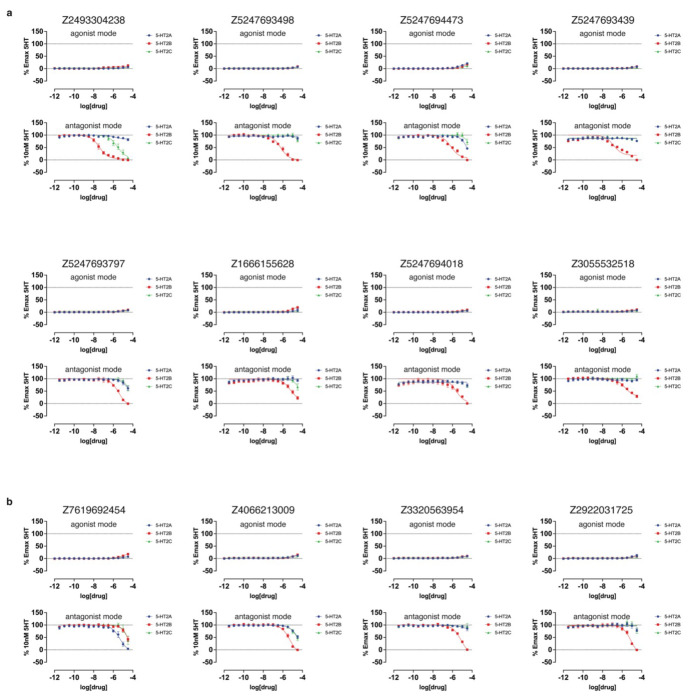
Extended Data Figure 12. Functional dose-response curves measuring calcium mobilization of compounds exhibiting antagonist activity across any of the three 5-HT2-type receptors.
These compounds were tested at the 5-HT2A (blue), 5-HT2B (red), and 5-HT2C (green) receptors. a. Calcium mobilization assays performed in agonist mode (top) and antagonist mode (bottom) for compounds from the cryoEM docking set. b. Calcium mobilization assays performed in agonist mode (top) and antagonist mode (bottom) for compounds from the AF2 docking set. Data represent mean ± s.e.m. from three biological replicates.

