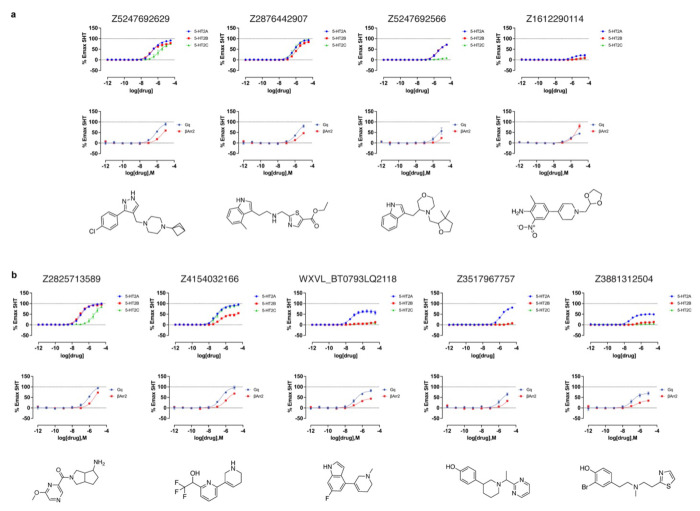
Figure 4 |. Dose-response curves of the top agonists against 5-HT2A, 5-HT2B, and 5-HT2C.
Top agonists from both docking campaigns were tested at the 5-HT2A (blue), 5-HT2B (red), and 5-HT2C (green) receptors. a. Functional assays measuring calcium mobilization (top) and Gαq protein dissociation or β-arrestin2 recruitment (bottom) for the top4 agonists from the cryoEM docking campaign. b. Functional assays measuring calcium mobilization (top) and Gαq protein dissociation or β-arrestin2 recruitment (bottom) for the top5 agonists from the AF2 docking campaign. The chemical structure of each compound is displayed below its respective dose-response curve. Data are presented as mean ± s.e.m. of three biological replicates.

