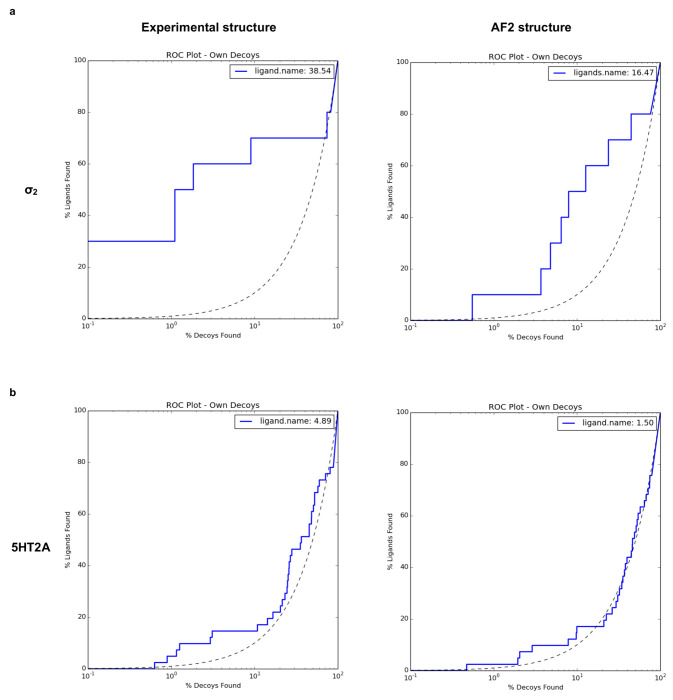
Extended Data Fig. 2 |. Retrospective docking of known ligands against experimental structures (left column) outperforms that for AF2 structures (right column).
Panels a and b show log-transformed ROC plots that compare the rate of ligand identification versus property-matched decoys for the σ2 receptor and the 5-HT2A receptor, respectively. A random selection corresponds to the dashed black line. The area under this dashed line is subtracted from the reported LogAUC values. As a result, a curve above the line indicates a positive LogAUC, a curve below the line signifies a negative LogAUC, and a curve following the dashed line represents a LogAUC value of zero. In both instances, the overall LogAUC value is better when docking against experimental structures.

