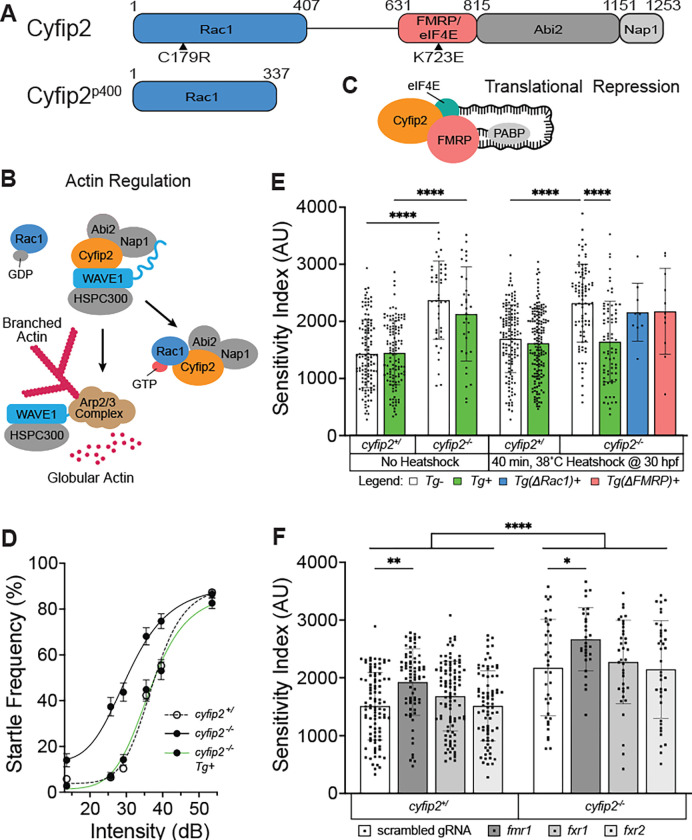
Figure 1. Cyfip2 establishes the acoustic startle threshold through Rac1 and FMRP.
(A) Cyfip2 protein interacting domain diagram of wildtype (top) and mutant (bottom) Cyfip2 proteins. Black arrowheads indicate the positions of induced mutations in Cyfip2, eliminating the Rac1− (C179R) or FMRP/eIF4E (K723E)-binding capacity of Cyfip2. (B) Cyfip2 actin regulatory pathway wherein Cyfip2 (orange) upon stimulation by Rac1−GTP triggers WAVE1 activation, Arp2/3-complex initiation and branched actin nucleation. (C) Cyfip2 translational repression pathway in which Cyfip2, eIF4E (teal), and FMRP (pink) along with the poly-A binding protein (PABP; gray), sequester neurodevelopmentally important mRNAs from being translated. (D) Average startle frequency (%) after 10 trials at 13.6, 25.7, 29.2, 35.5, 39.6 and 53.6 dB for 5 dpf cyfip2 siblings (+/) and mutant (−/−) larvae heatshocked at 30 hpf for 40 minutes at 38°C. The average startle frequency curve for cyfip2 siblings (+/; open circles, dashed line), cyfip2 mutants (−/−; closed circles, solid line) and cyfip2 mutants harboring the Tg(hsp70:cyfip2-EGFP)+ transgene (−/−; Tg+; closed circles, solid green line). (E) Sensitivity indices, calculated as the area under the startle frequency curves, for 5 dpf cyfip2 siblings and mutants, following a 40-minute heatshock at 30 hpf to express either wildtype (Tg+; green), Rac1− (ΔRac1+; blue) or FMRP/eIF4E- (ΔFMRP+; pink) binding deficient versions of Cyfip2-EGFP. Comparisons were made to both non-transgenic (Tg−) and non-heatshocked controls. All indices (mean ± SD) compared using a Kruskal-Wallis test with Dunn’s multiple comparisons correction; p**** < 0.0001. (F) Sensitivity indices for 5 dpf cyfip2 sibling (+/) and mutant (−/−) larvae following 1-cell stage injection with CRISPR-Cas9 and a single, scrambled guide RNA (gRNA) or dual gRNA cocktails targeting fmr1, fxr1, or fxr2. scrambled gRNA injected (white bar, closed circles); fmr1 gRNA injected (dark gray bar closed circles); fxr1 gRNA injected (medium gray bar; closed circles); fxr2 gRNA injected (light gray bar, closed circles). Comparisons were made both within genotype and between genotypes by condition. All indices (mean ± SD) compared using an Ordinary one-way ANOVA with Sidak’s multiple comparisons correction; p* < 0.05; p** < 0.01; p**** < 0.0001.

