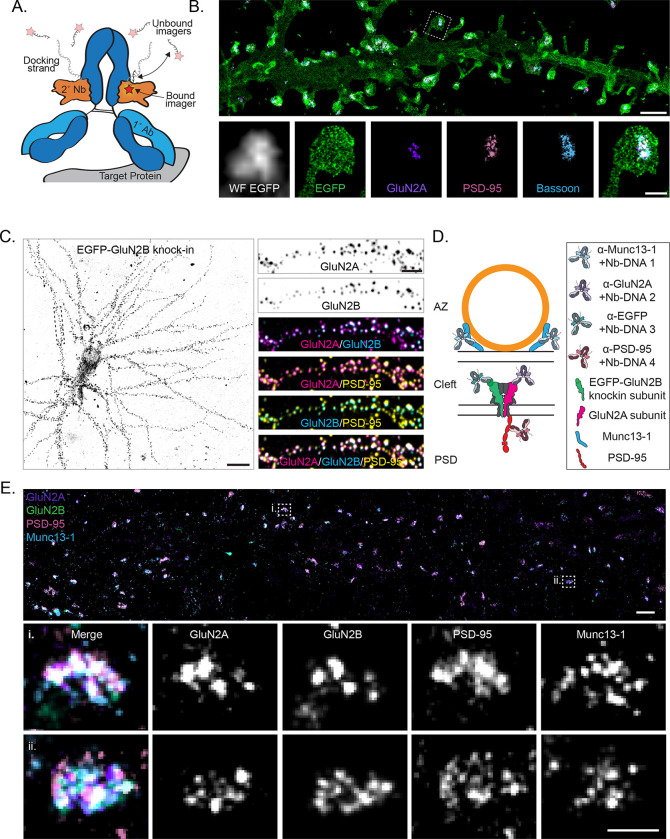
Figure 1.
Mapping endogenous NMDA receptor organization with DNA-PAINT. a) Schematic of a primary antibody labeled with a DNA-PAINT docking strand-conjugated secondary nanobody and imaged with fluorescent imager strands. Red star indicates fluorophore. b) (top) DNA-PAINT rendering (10 nm pixels) of myristoylated-EGFP cell fill, surface expressed GluN2A, PSD-95, and Bassoon demonstrating four-target, synaptic DNA-PAINT. Scale bar 2 μm. (bottom) Boxed region from top, including widefield image of myr-EGFP. Scale bar 500 nm. c) (left) Confocal image of EGFP-GluN2B CRISPR knock-in cell. Scale bar 20 μm. (right) Boxed region from left, showing surface expressed GluN2A, surface expressed GluN2B (EGFP knock-in), and PSD-95 labeling colocalized at synapses. Scale bar 4 μm. d) Schematic of four-target DNA-PAINT labeling of endogenous, surface expressed NMDAR subunits GluN2A and GluN2B with pre (Munc13–1) and postsynaptic (PSD-95) molecular context using primary antibodies preincubated with secondary nanobodies. This labeling scheme is used throughout the figures. e) (top) DNA-PAINT rendering (10 nm pixels) of endogenous, surface expressed GluN2A and GluN2B (EGFP knock-in), PSD-95, and Munc13–1. Scale bar 1 μm. (bottom) Zoom-in on two representative synapses showing nanoclusters of each protein and their co-organization. Scale bar 200 nm.

