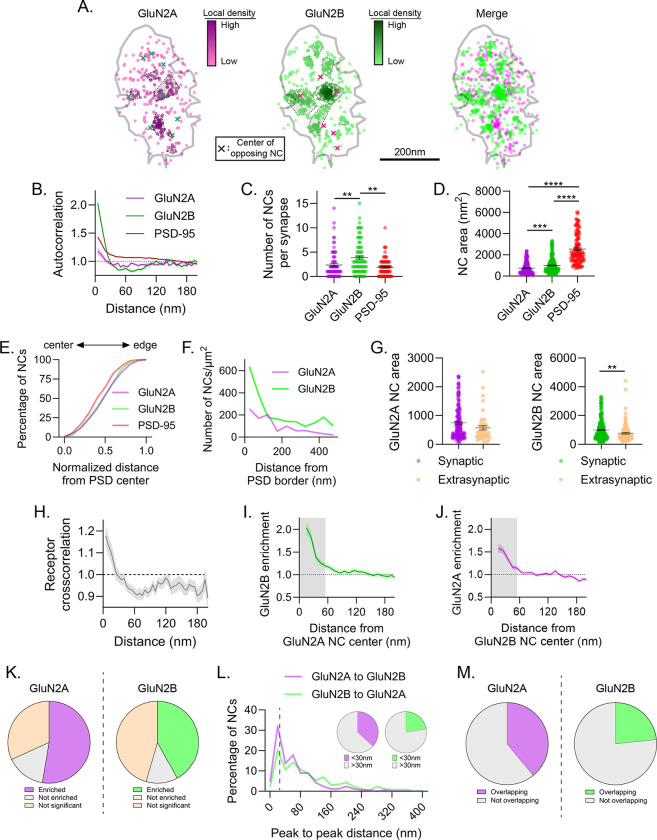
Figure 2.
Endogenous GluN2 subunits form diverse nanodomain types. a) Example synapse of DNA-PAINT localizations of GluN2A and GluN2B showing GluN2 NCs have diverse co-organization. Each point is a localization and its heat map codes normalized local density. NCs are indicated by gray-shaded, dash-bordered areas. Centers of the NCs of the opposing protein are indicated by colored x’s. Gray line indicates PSD border, defined by PSD-95 localizations (not shown). b-e) Characterization of GluN2 subunit subsynaptic organization. GluN2 subunit autocorrelations decayed faster than PSD-95 and plateaued below one, indicating small NCs with few localizations between them (b). Detected GluN2B NCs were more numerous than GluN2A or PSD-95 NCs (c), and both GluN2A and GluN2B NCs were smaller (d) and distributed slightly less centrally (e) than PSD-95 NCs. f-g) Characterization of extrasynaptic GluN2 subunit distribution. Extrasynaptic GluN2 tended to be within ~200 nm of the PSD edge (f) and formed clusters on average smaller than synaptic GluN2 NCs (g). h-m) Characterization of GluN2 subunit nanodomains. Cross-correlation (h) and cross-enrichment (i-j) indicated strong overlap of GluN2A and GluN2B densities at short distances. 52.6% of GluN2A and 42.0% of GluN2B NCs were significantly enriched with the opposite subunit (k), 36.7% of GluN2A and 22.6% of GluN2B NC peaks were located within 30 nm of an opposite GluN2 NC peak (l), and 39.0% of GluN2A and 23.4% of GluN2B NC areas spatially overlapped with the opposite subunit (m), indicating that a subset of GluN2 NCs are co-enriched at the synapse. Data in b and h-j are means ± SEM shading. Points in c are individual synapses and points in d and g individual NCs. Lines in c, d and g are means ± SEM. Data in l are shown as frequency histograms (20 nm bins), with dashed line indicating the division summarized in inset pie charts. *p<0.05, **p<0.01, ****p<0.0001

