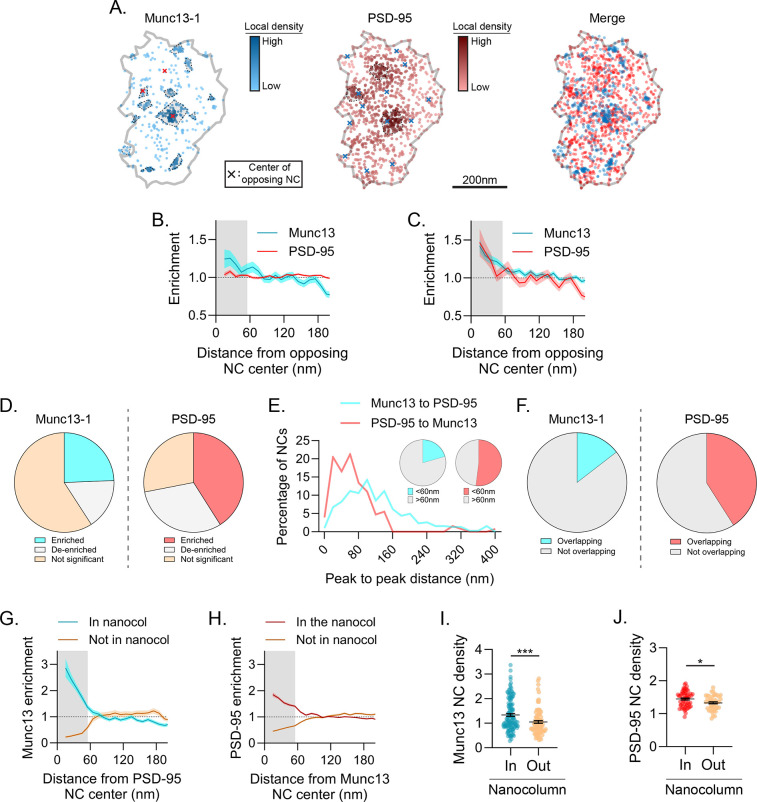
Figure 4.
A subset of structurally unique Munc13–1 NCs is enriched with PSD-95 and in the nanocolumn. a) Example synapse of DNA-PAINT localizations of Munc13–1 and PSD-95, showing variable position of Munc13–1 NCs relative to PSD-95 density. Markers as in Fig 2a. b-f) A subset of Munc13–1 NCs is enriched with PSD-95. On average Munc13–1 and PSD-95 were weakly enriched with one another (b), but after pairing (as in 3g) both were significantly enriched (c). When subsetting the data, 24.4% of Munc13–1 and 41.0% of PSD-95 NCs were statistically enriched with the other protein (d), 20.6% of Munc13–1 and 52.0% of PSD-95 NCs had a NC peak of the other protein within 60 nm (e), and 14.5% of Munc13–1 and 40.9% of PSD-95 NCs were spatially overlapped (f). g-h) Cross-enrichments of PSD-95 NCs with Munc13–1 (g) or vice versa (h) demonstrate strong cross-enrichment of these proteins when subset by the data in 4d. i-j) Munc13–1 (i) and PSD-95 (j) NCs were denser when in the nanocolumn than when outside it. Data in b-c and g-h are means ± SEM shading. Points in i and j are NCs with lines at mean ± SEM. ****p<0.0001, *p<0.05.

