
Fig. 1.
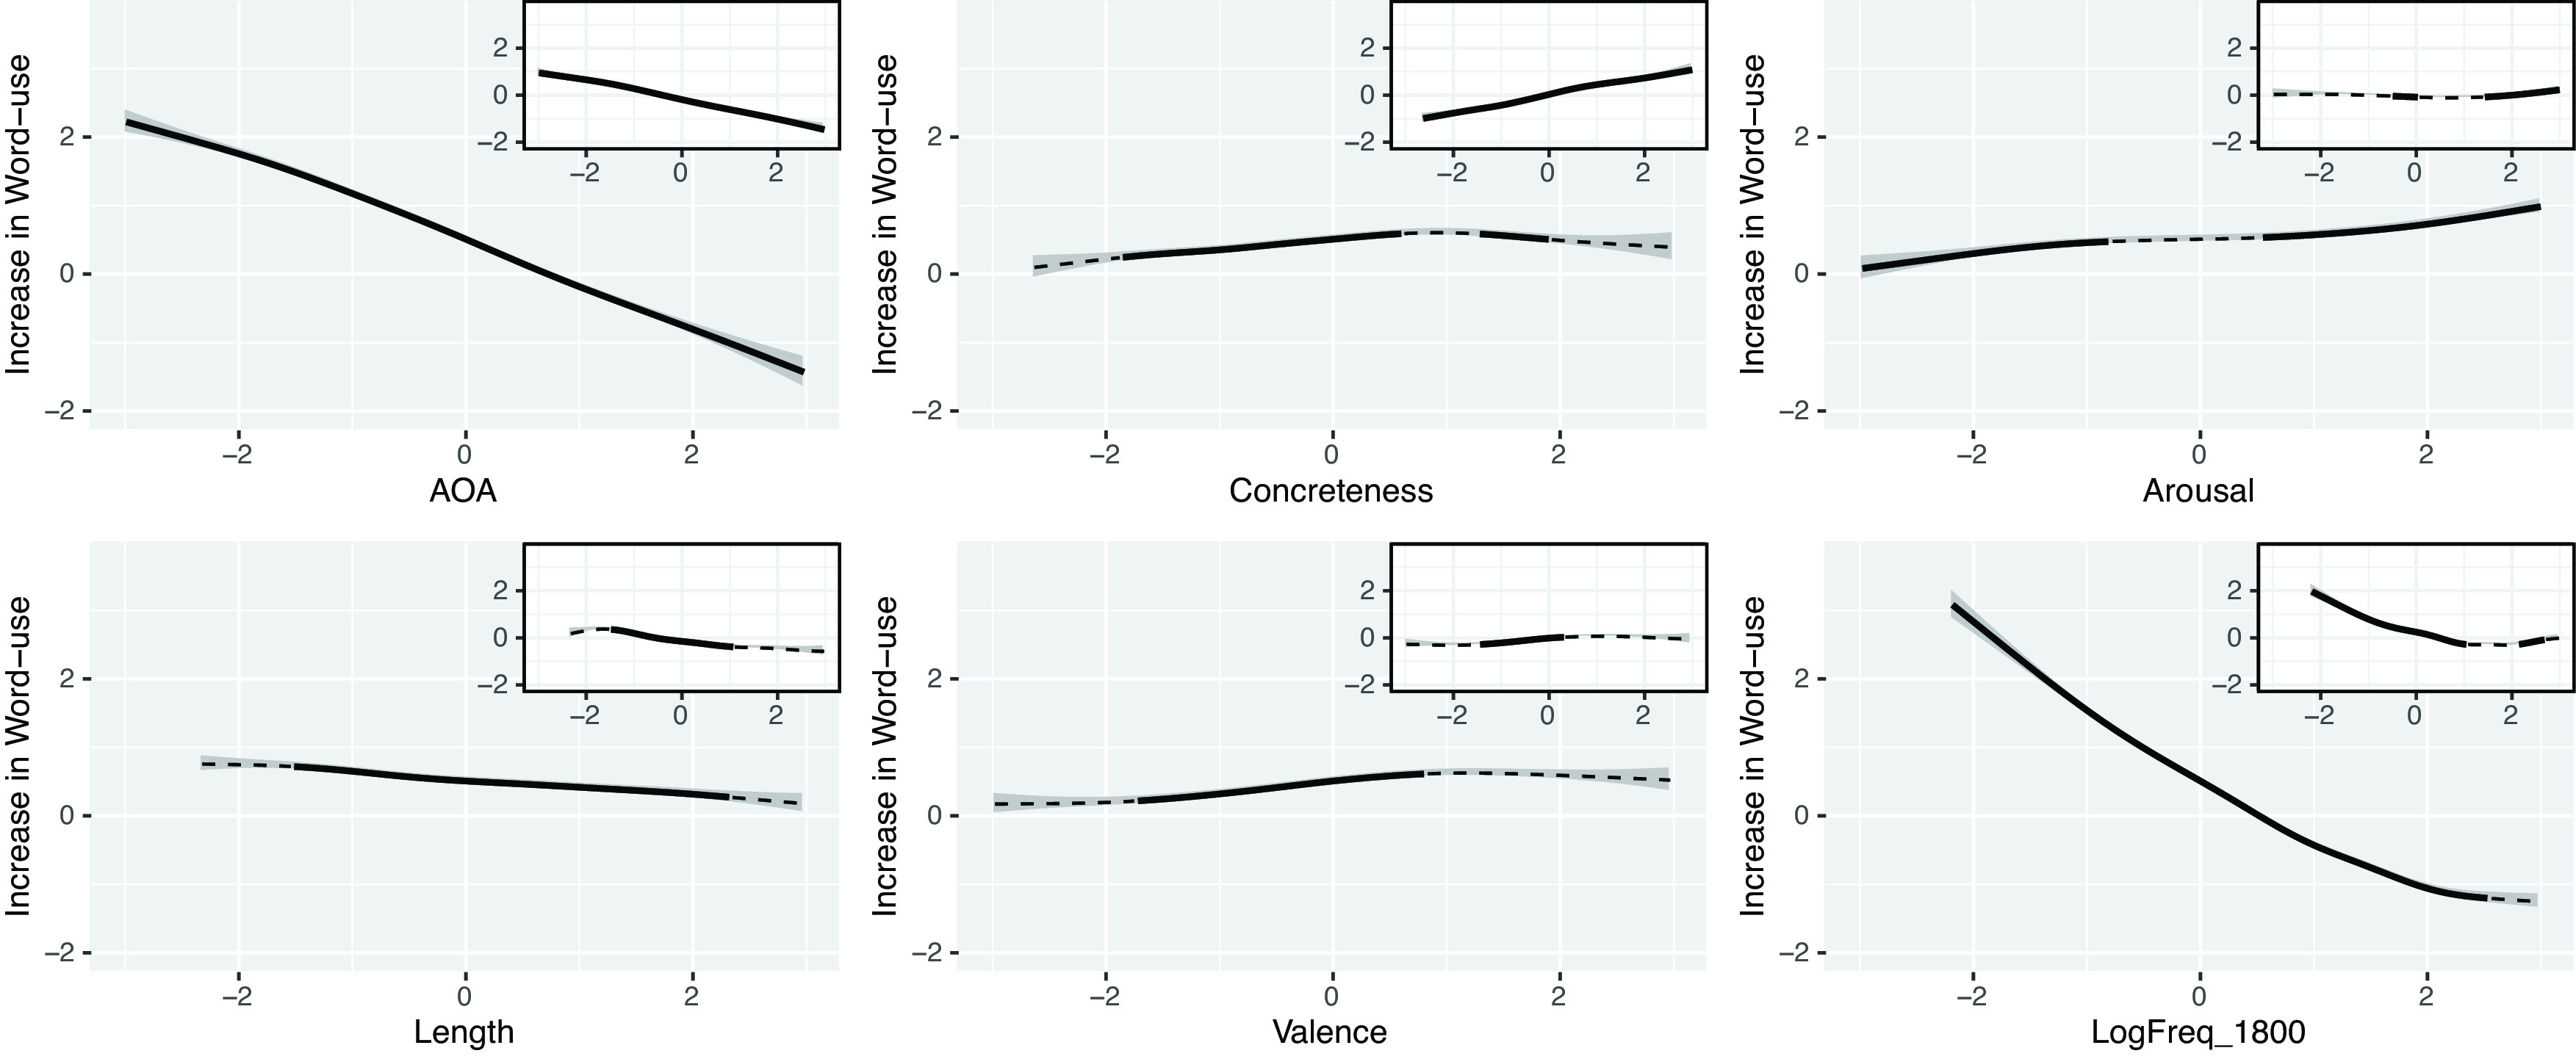
The partial relationship between log frequency changes between 1800 and 2000 (y-axis) and six psycholinguistic properties (x-axis). The inset plots show one-to-one relationship between log frequency changes and each psycholinguistic property. All independent variables are scaled and centered around 0. Lines are model estimates (dotted lines are estimates and solid lines indicate where the estimates are significantly increasing or decreasing). Shading indicates 95% CIs around the estimates.