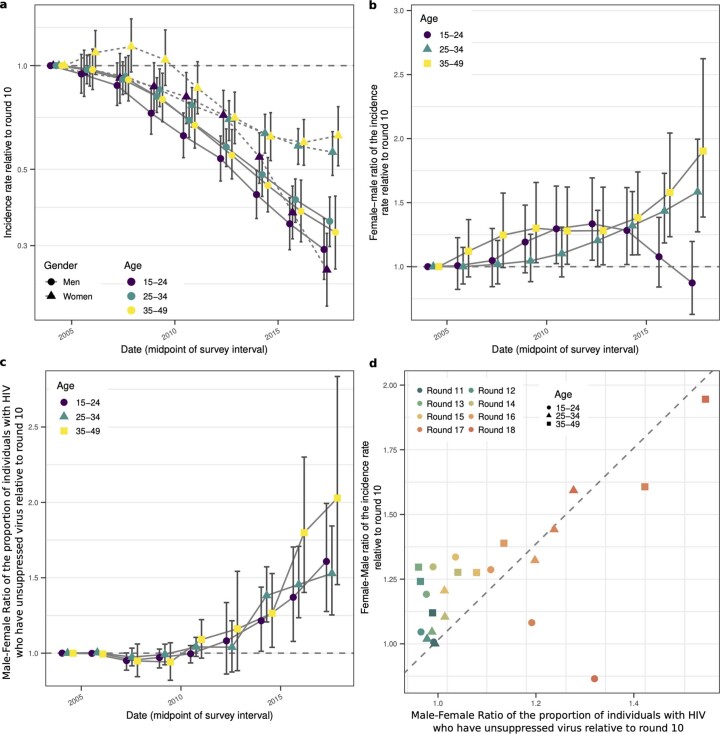
Extended Data Fig. 9. Longitudinal changes in viral suppression and incidence rates in the RCCS study population since 2003.
(a) Changes in incidence rates relative to round 10, that is Sep 2003 to Oct 2004 (posterior median: dots, 95% confidence interval: error bars). (b) Female-to-male ratio in changes in incidence rates relative to round 10 (posterior median: dots, 95% credible interval: error bars). (c) Male-to-female ratio in changes in the proportion of individuals with HIV who have unsuppressed virus relative to round 10 (posterior median: dots, 95% credible interval: error bars). (d) Scatter plot between the female-to-male ratio in changes in incidence rates as shown in (b) and the male-to-female ratio in changes in the proportion of individuals with HIV who have unsuppressed virus relative to round 10 as shown in (c). Throughout all subfigures, estimates are based on n = 1,117 individuals in the incidence cohort and n = 3, 265 participants with HIV and measured viral load.

