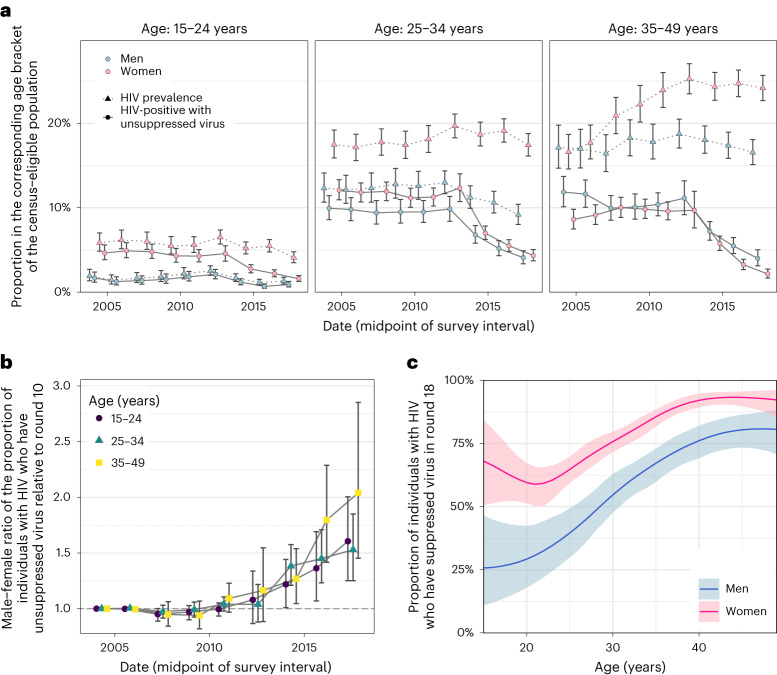
Fig. 3. Changes in population-level suppression of HIV viral load.
a, Estimated trends of HIV prevalence and the proportion of census-eligible individuals in three age brackets that remain virally unsuppressed, defined as viral load above 1,000 copies per ml of plasma (posterior median: dots; 95% credible interval: error bars), combining data from participants and from first-time participants as proxy of non-participants. b, Male-to-female ratio of changes in population-level viral load suppression relative to survey round 10 (posterior median: dots; 95% credible interval: error bars). c, Estimated viral suppression rates by 1-year age band (x axis) and gender (colour) for survey round 18 (posterior median: dots; 95% credible interval: error bars). Throughout all subfigures, estimates are based on data from n = 38,749 participants including n = 3,265 participants with HIV and with measured viral load. First-time participants were used as proxies of individuals who did not participate in the survey.

