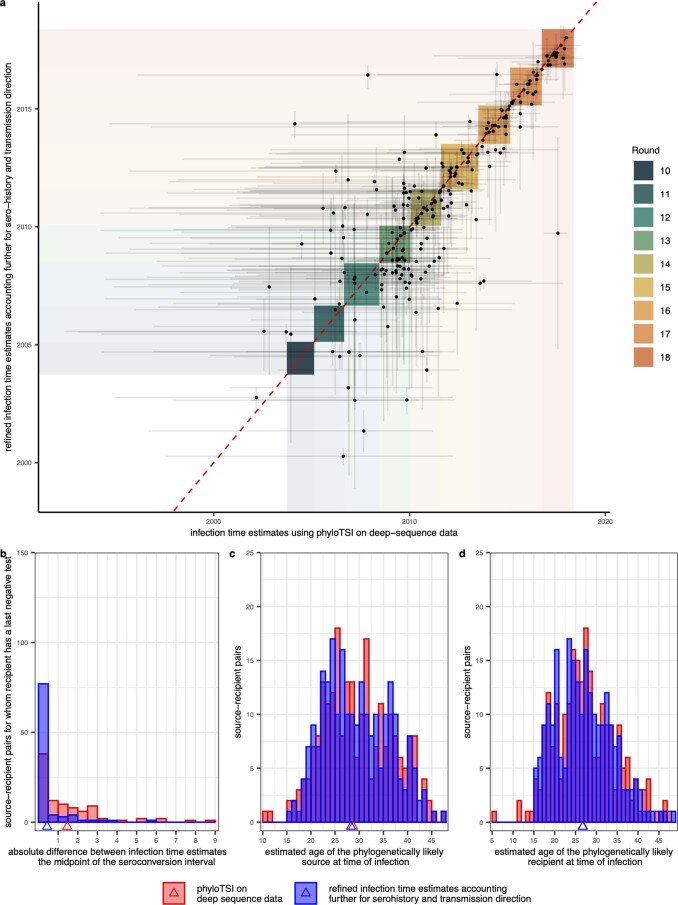
Extended Data Fig. 4. Comparison of estimated infection dates in phylogenetically reconstructed source–recipient pairs.
(a) Estimated infection times of the recipient in the n = 227 phylogenetically reconstructed source–recipient pairs from phyloTSI based on deep-sequence data alone (x-axis) against refined estimates accounting for sero-history and inferred direction of transmission (y-axis). Median estimates (dots) are shown along 95% uncertainty ranges (lines). (b) Histogram of absolute difference (bars) and mean absolute differences (triangle) between infection time estimates and the midpoint of seroconversion intervals in 98 source–recipient pairs in which the recipient had a last negative test, across the two methods (colour). (c) Histogram (bars) and median (triangle) age of the phylogenetically likely recipient, across the two methods (colours). (d) Histogram (bars) and median (triangle) age of the phylogenetically likely source, across the two methods (colours).

