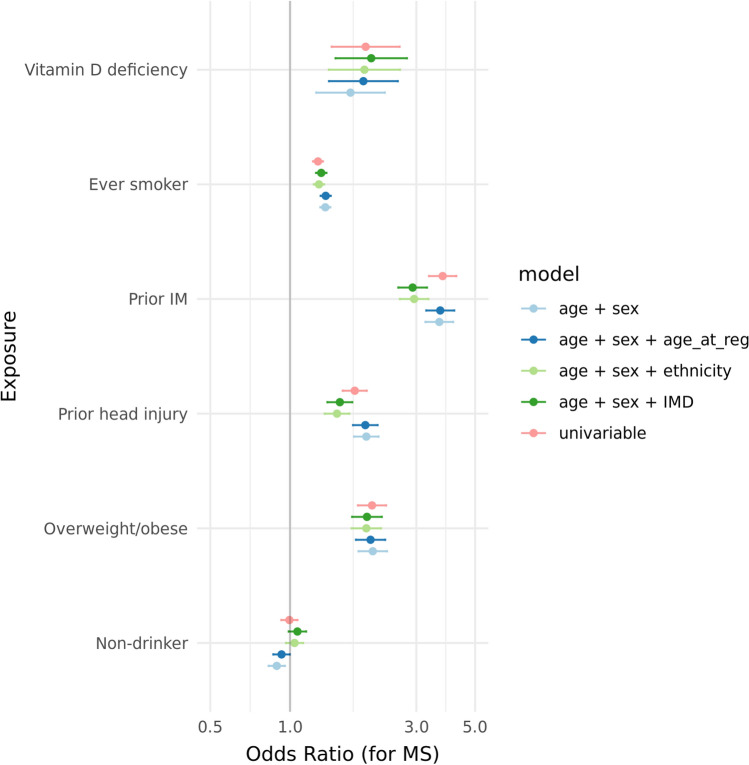
Fig. 2.
Case–control study of multiple sclerosis risk in CPRD Aurum recapitulates the roles of established exposures. Each point represents the odds ratio and its 95% confidence interval calculated from multivariable logistic regression models for each exposure, adjusted for age and gender. The y-axis indicates each exposure. The x-axis is on the log10 scale. Points are coloured according to which model they were derived from. The primary analysis models adjusted for index age and gender. Secondary sensitivity analyses adjusted for age at registration (age_at_reg), ethnicity, and deprivation status (IMD; Indices of Multiple Deprivation)

