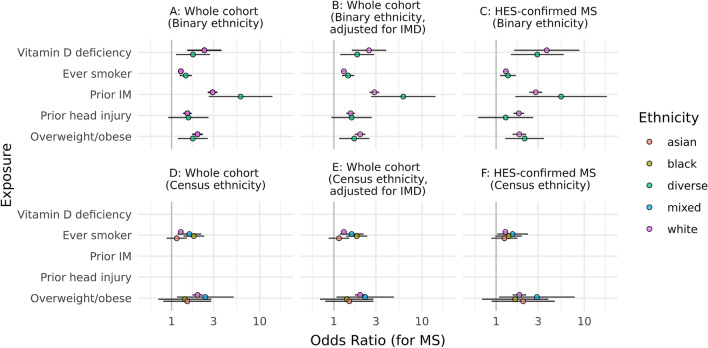
Fig. 3.
Stratified analysis of MS risk factors according to ethnic background. Odds ratios and 95% confidence intervals for multiple sclerosis given each exposure on the y axis. Odds ratios represent the estimates from logistic regression models adjusted for index age and gender. Effect estimates are coloured according to ethnic background. Several forest plots are presented, representing different sensitivity analyses. A Analysis of the whole cohort is shown, with ethnicity dichotomised into ‘White’ and ‘Diverse’ ethnic groups. B Analysis of the whole cohort, models adjusted for index age, gender, and deprivation status (i.e. IMD quintile). C cohort restricted to cases with HES-confirmed MS, i.e. orthogonal evidence of having MS provided by hospital episode statistics. Models adjusted for index age and gender. E, F Analyses depict models stratified by more granular ethnicity categories, corresponding to UK Census categories. Only BMI and smoking were analysed in this way due to low case numbers for other exposures. D Analysis of the whole cohort, models adjusted for index age and gender. E Whole cohort, models adjusted for index age, gender, and deprivation status. F HES-confirmed MS, models adjusted for index age and gender. The x-axis is on a log10 scale

