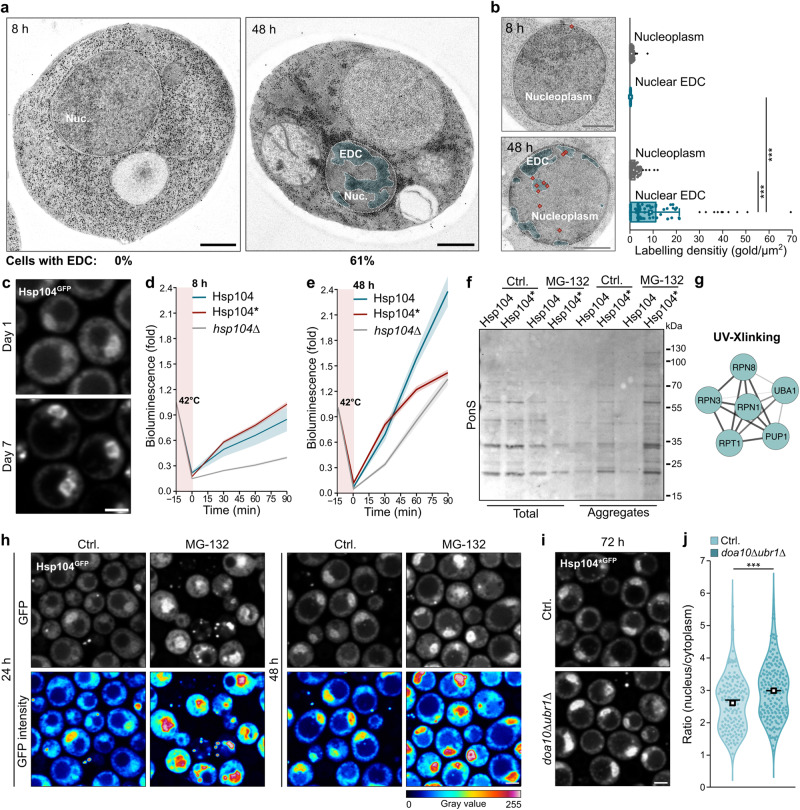
Fig. 7. Hsp104 manages misfolded proteins in the nucleus of aged cells.
a Transmission electron micrographs of wild type cells at indicated time points. Nuclear electron-dense clusters (EDC) were quantified (100 cells per time point). Nuc. = Nucleus. Scale bar: 500 nm. b Hsp104 immunogold-labeling of cells described in (a). Micrographs and quantification of gold labeling density are depicted. EDC and the nucleoplasm are highlighted and the immunogold signal is depicted as diamonds. Box plots with mean (square), median (line) and whiskers with minima and maxima within 1.5 interquartile range are shown (100 cells per time point). Scale bar: 500 µm. c Micrographs of cells endogenously expressing Hsp104GFP on day 1 and day 7. Scale bar: 2 µm. d, e Refolding rates of nuclear-targeted, temperature-labile firefly luciferase after heat inactivation at 8 h (d) and 48 h (e). In vivo refolding was assessed in cells harboring GFP-tagged Hsp104 or Hsp104* as well as hsp104∆ cells. Line graph with mean ± s.e.m., n = 4 biological replicates. f Ponceau S (PonS) stained membranes to visualize proteins from total cellular lysates (left) and isolated aggregates (right) of cells (pdr5∆) harboring GFP-tagged Hsp104 or Hsp104* on day 5. Cells were treated with MG-132 at inoculation for proteasomal inhibition. For the aggregate fractions, correspondingly 18x more sample was loaded to ensure visibility. g Visualization of genes associated with the term “Proteasome” as prominent enrichment cluster from UV-crosslinking experiments. See Fig. 5b for the complete STRING network and Supplementary Fig. 5a for enrichment analysis via Markov clustering. h Micrographs of cells (pdr5∆) harboring Hsp104GFP treated with MG-132. Scale bar: 2 µm. i Micrographs of cells (wild type and doa10∆ubr1∆) endogenously expressing Hsp104GFP at 72 h. Scale bar: 2 µm. j Quantification of the mean GFP intensity ratio between the nucleus and cytoplasm of cells described in (i). Violin plots with mean (square) and median (line). Each dot represents one cell (Ctrl.: 157 cells; doa10∆ubr1∆: 182 cells). Measurements were taken from 3 biological replicates. ***p < 0.001. Source data are provided as a Source Data file. See Supplementary Table 3 for details on statistical analyses.

