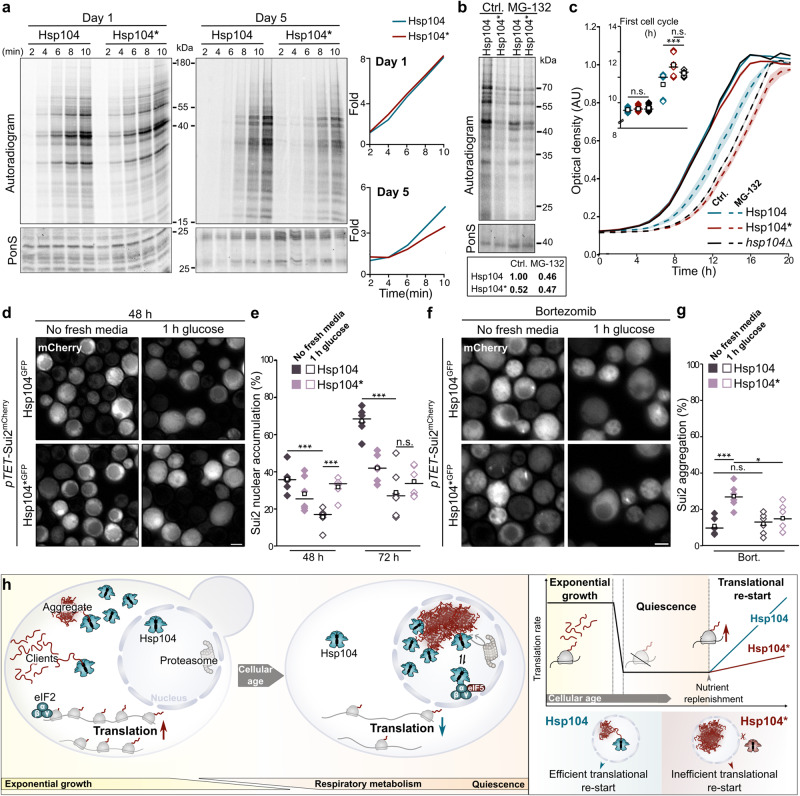
Fig. 8. Nuclear Hsp104 ensures rapid restart of translation to support quiescence exit.
a [35S]-methionine radiolabeling of nascent proteins in cells harboring endogenously GFP-tagged Hsp104 or Hsp104*. Quantification of the autoradiogram (line graphs), with ponceau S (PonS) as loading control. b [35S]-methionine radiolabeling of nascent proteins from cells (pdr5∆) harboring endogenously GFP-tagged Hsp104 or Hsp104* on day 5. MG-132 was added at inoculation. PonS served as loading control. Relative autoradiogram intensity is provided. c Regrowth kinetics of cells (pdr5∆) harboring endogenously GFP-tagged Hsp104 or Hsp104* as well as of cells lacking Hsp104 cultured for 5 days. MG-132 was added at inoculation. Time for completion of the first cell cycle (inlet). Line graph with mean ± s.e.m., n = 9 biological replicates. d Micrographs of cells expressing mCherry-tagged eIF2α/Sui2 controlled by the TET promoter (pTET-Sui2mCherry). At 48 h cells were shifted to fresh media 1 h prior to analysis. Control conditions overlap with Fig. 5f, g. Scale bar: 2 µm. e Quantification of nuclear accumulation of Sui2 in cells described in (d) and cells shifted to fresh media at 72 h (corresponding micrographs in Supplementary Fig. 7f). Dot plots with mean (square) and median (line). Each dot represents one biological replicate (Ctrl − 48 h Hsp104: 401 cells, 48 h Hsp104*: 543 cells; Glucose – 48 h Hsp104: 436 cells, 48 h Hsp104*: 340 cells; Ctrl − 72 h Hsp104: 294 cells, 72 h Hsp104*: 464 cells; Glucose – 72 h Hsp104: 406 cells, 72 h Hsp104*: 378 cells). f Micrographs of cells described in (d) but with the addition of Bortezomib at initial inoculation. g Quantification of aggregation of Sui2 in cells described in (d). Dot plots with mean (square) and median (line). Each dot represents one biological replicate (Bort. Ctrl − 48 h Hsp104: 517 cells, 48 h Hsp104*: 523 cells; Bort. Glucose – 48 h Hsp104: 465 cells, 48 h Hsp104*: 442 cells). h Model describing Hsp104 function and regulation. n.s.: not significant (p ≥ 0.05); *p < 0.05; ***p < 0.001. Source data are provided as a Source Data file. See Supplementary Table 3 for details on statistical analyses.

