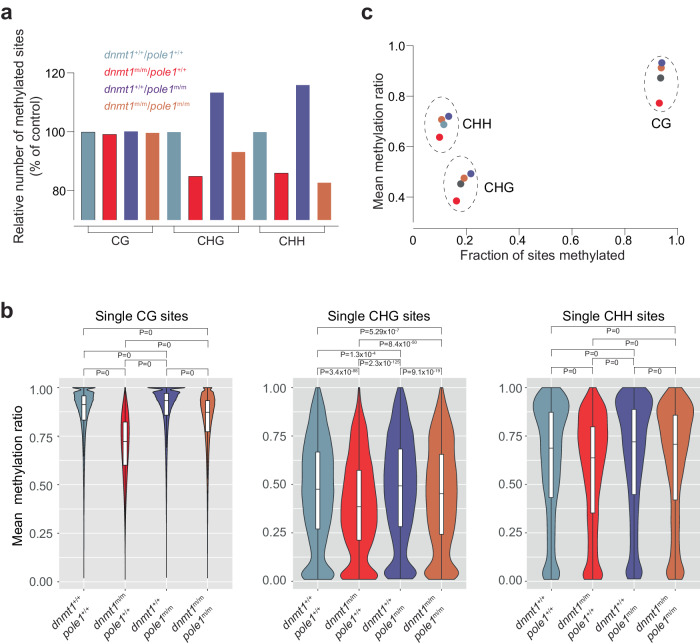
Fig. 5. Alterations in non-CG methylation patterns in dnmt1 and pole1 mutants.
a Variable numbers of methylated sites for CG dinucleotides, and CHG and CHH tri-nucleotides. The number of sites in wild-type fish is set to 100 (for absolute numbers of total and methylated sites, see Supplementary Table 1). b Violin plots of methylation ratios; median±m.a.d. The significance levels of the differences between mean methylation ratios are indicated (t-test, two-tailed; corrected for multiple testing). c Correlation plot between the fractions of sites methylated and their mean methylation ratios. For b, c, color code for genotypes indicated in a.

