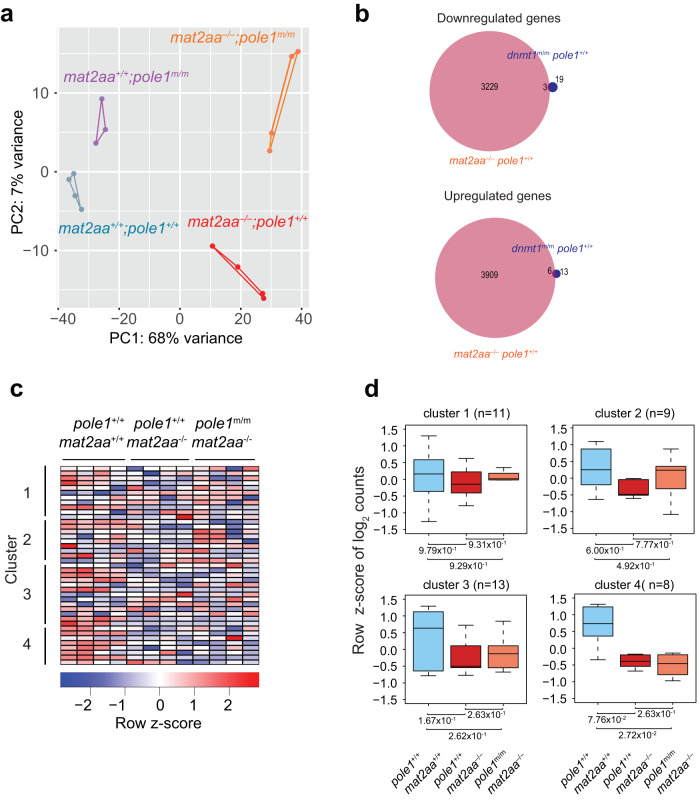
Fig. 8. Transcriptional landscapes in mat2aa and pole1 mutants.
a Dynamic changes in transcriptomes of mat2aa and pole1 single and double mutants, as indicated by principal component analysis. b Venn diagram indicating the overlap of differentially expressed genes for down-regulated and up-regulated genes in fish of the indicated genotypes. c Expression patterns of genes in the four clusters of co-regulated genes identified in dnmt1 mutant fish; each column represents a biological replicate. d No restoration of expression levels in mat2aa/pole1 double mutants for the genes in the four groups identified in dnmt1 mutant fish; box plots (mean; box, upper/lower quartile; whiskers, minimal/maximal values).

