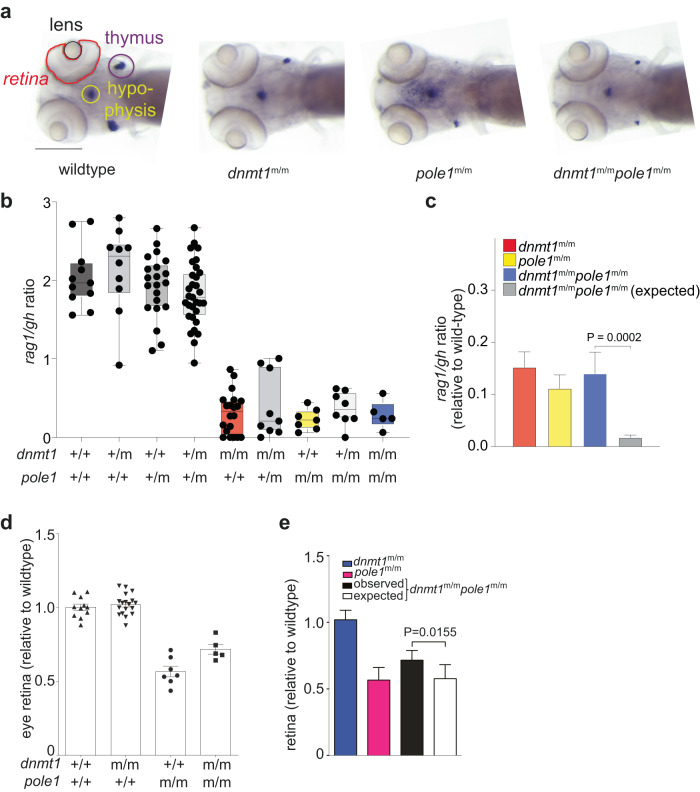
Fig. 9. Epistasis analysis of dnmt1 and pole1 mutations.
a Whole-mount RNA in situ hybridization results of larvae of the indicated genotypes are shown (rag1 signal in thymus [indicated by purple circle]; gh signal in hypophysis [indicated by light green circle]). The lens and retina are outlined. Scale bar, 1 mm. b Representation of rag1/gh ratios of fish with the indicated genotypes (each symbol represents an individual fish); mean±s.e.m. c Quantitative analysis of data in (a) (mean±s.d.; t-test; two-tailed); alleviating interaction according to the multiplicative model (see Methods) is demonstrated. d Relative size of retinas of fish with the indicated genotypes (each symbol represents an individual fish; mean±s.e.m. e Quantitative analysis of data in (d) (mean±s.d.; t-test; two-tailed); alleviating interaction according to the multiplicative model (see Methods) is demonstrated.

