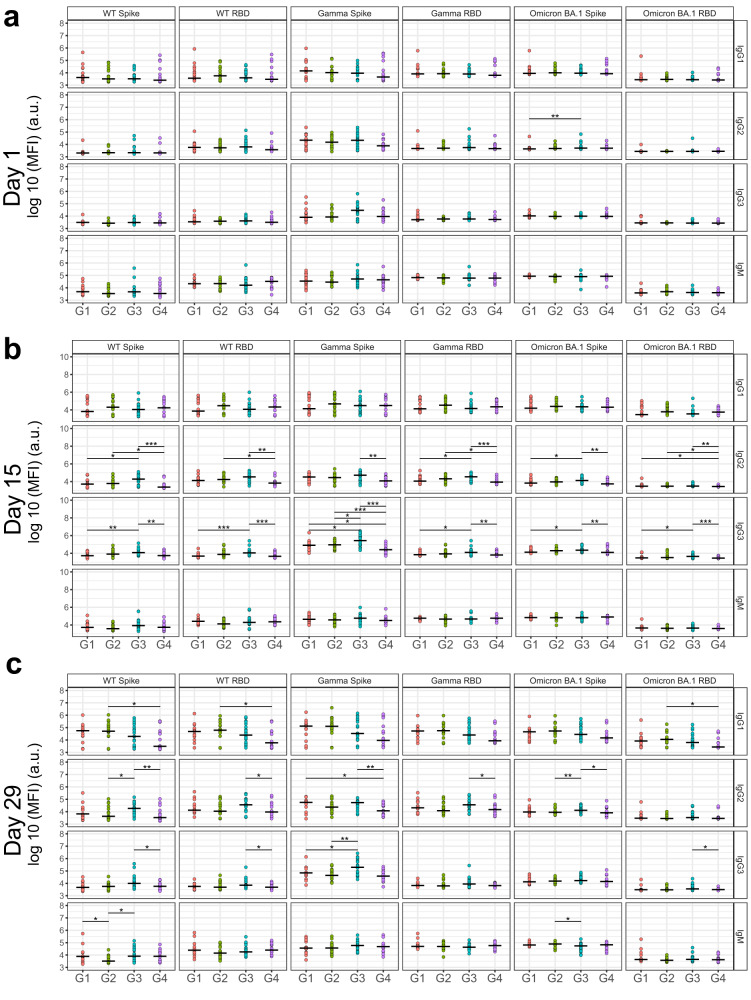
Fig. 2. Univariate differences in antibody binding titers among treatment groups.
a Baseline antibody features against the indicated antigen of Groups 1, 2, 3, and 4 (designated G1, G2, G3, and G4, respectively) are shown against VOC Spike and RBD, as well as WT Spike and RBD. Shown on the y axis is the binding median fluorescence intensity (MFI) in log base 10 of the indicated antibody isotype or subclass. b Same as (a), but for antibody binding profiles at day 15. c Same as (a), but for antibody binding profiles at day 29. *P < 0.05, **P < 0.01 ***P < 0.001 before multiple test correction (Wilcoxon rank-sum test). Groups 1, 2, 3, and 4 refer to treatment arms of 9 µg of SCB-2019 + Alum, 9 µg of SCB-2019 + Alum + CpG, 30 µg of SCB-2019 + Alum + CpG, and ChAdOx1, respectively. a.u. arbitraray unit.

