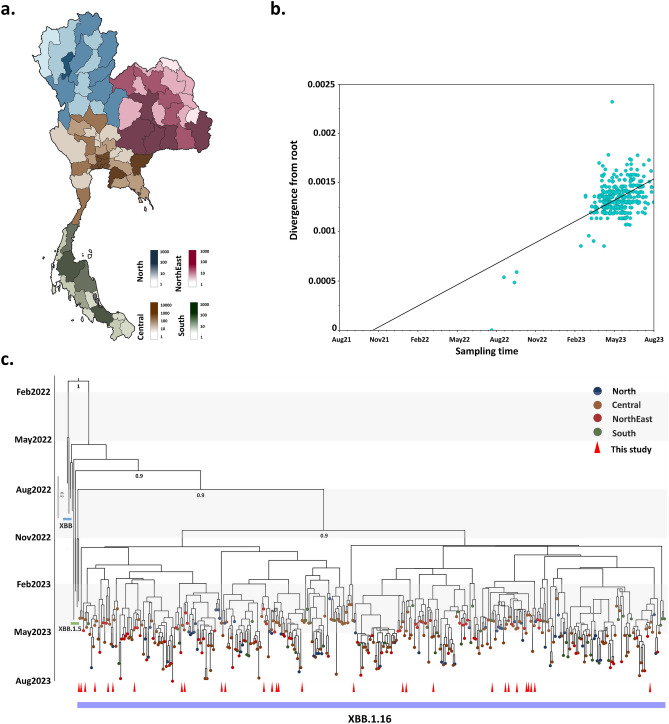
Figure 3.
(a) Map of the regions in Thailand most affected by the SARS-CoV-2 outbreak from December 2022 to August 202331. Administrative divisions in the northern, central, northeastern, and southern areas are differentiated by blue, brown, red, and green color respectively. These colors represent the cumulative numbers of confirmed and suspected cases reported throughout the outbreak. (b) Root-to-tip regression of genetic distances against sampling time (month) for SARS-CoV-2 XBB.1.16 variant sequences based on a maximum likelihood tree. (c) Temporal phylogeny of all publicly accessible XBB.1.16 genomes in Thailand estimated using BEAST. Each tip is color-coded based on the probable region within the country where the patient was infected.

