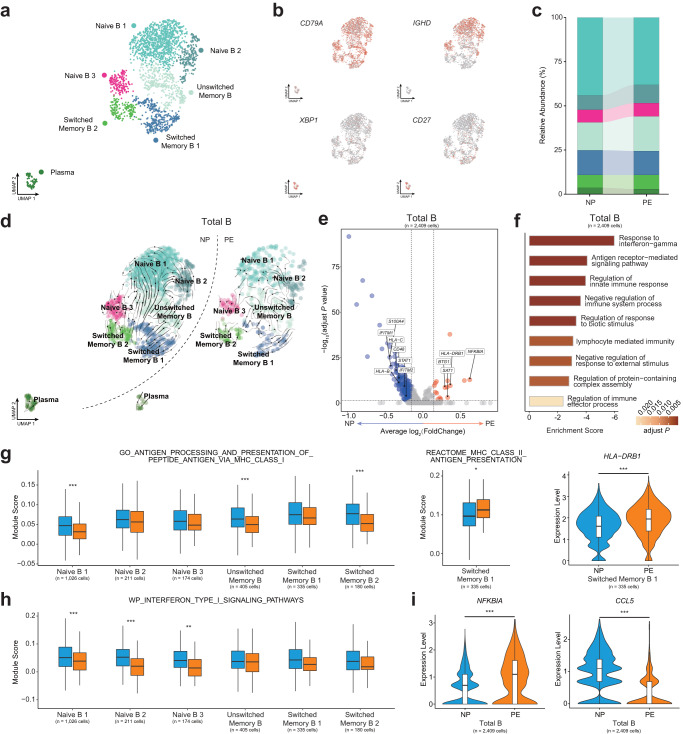
Fig. 2. Sub-clustering and analyzing the function of B cell subsets.
a UMAP plot shows seven clusters of B cells after subclustering and annotation. b UMAP plots show the expression of canonical markers of B cell subsets in NP and PE. c Relative abundance of the seven clusters of B cell subsets in NP and PE. d UMAP plots show the developmental trajectories of B cell subsets in NP (left panel) and PE (right panel), revealed by RNA velocity analysis. e Volcano plot illustrates the significantly downregulated (blue dots) and significantly upregulated (red dots) DEGs in total B cells when comparing PE to NP, Wilcoxon rank-sum test. f Go enrichment analysis of downregulated DEGs of PE and bar plot shows the enrichment scores of immune-related pathways in total B cells. g Box plots show the expression of MHC-I and MHC-II-related pathways in B cell subsets, Student’s t-test. Violin plot shows the expression of HLA-DRB1 in Switched Memory B 1, Wilcoxon rank-sum test. *adjust P < 0.05, ***adjust P < 0.001. h Box plots show the expression of interferon type I signaling pathways in B cell subsets, Student’s t-test. **adjust P < 0.01, ***adjust P < 0.001. i Violin plots show the expression of NFKBIA and CCL5 in total B cells, Wilcoxon rank-sum test. ***adjust P < 0.001. See also Supplementary Fig. 2 and Supplementary Data 3.

