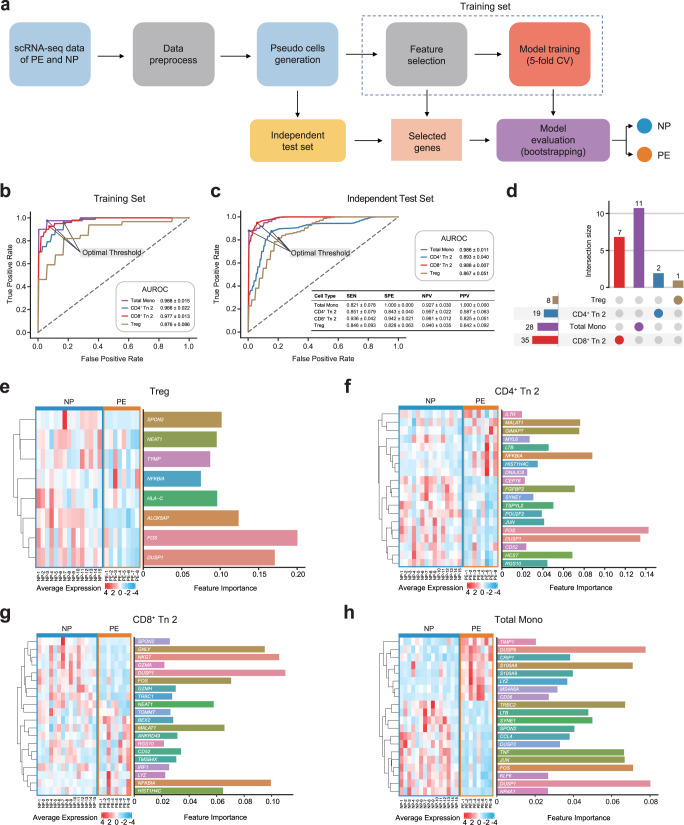
Fig. 6. Develop machine-learning models to diagnose preeclampsia and evaluate the model performance.
a Flowchart of developing cell-type-specific machine-learning models based on the scRNA-seq data of PBMCs from PE and NP. b, c The results of evaluation metrics showing the performance of the four cell-type-specific models for preeclampsia diagnosis using the training sets (b) and the independent test sets (c). AUROC: Area Under ROC Curve, SEN: Sensitivity, SPE: Specificity, NPV: Negative Predictive Value, PPV: Positive Predictive Value. d Upset plot shows the number of features in the four models respectively, the horizontal columns indicate the number of features in each model and the vertical columns indicate the number of cell-type-specific features in each model. e–h Top 20 important features determined and ranked by SHAP method, the horizontal columns indicate feature importance (right panel) and heatmaps show the average expression of selected gene features in individuals in each model, including Treg (e) CD4+ Tn 2 (f) CD8+ Tn 2 (g) and total Mono (h). See also Supplementary Fig. 5, Supplementary Table 1, 2 and Supplementary Data 3.

